Cuban vs Venezuelan College, Under 1 year
COMPARE
Cuban
Venezuelan
College, Under 1 year
College, Under 1 year Comparison
Cubans
Venezuelans
58.6%
COLLEGE, UNDER 1 YEAR
0.0/ 100
METRIC RATING
299th/ 347
METRIC RANK
66.7%
COLLEGE, UNDER 1 YEAR
85.9/ 100
METRIC RATING
139th/ 347
METRIC RANK
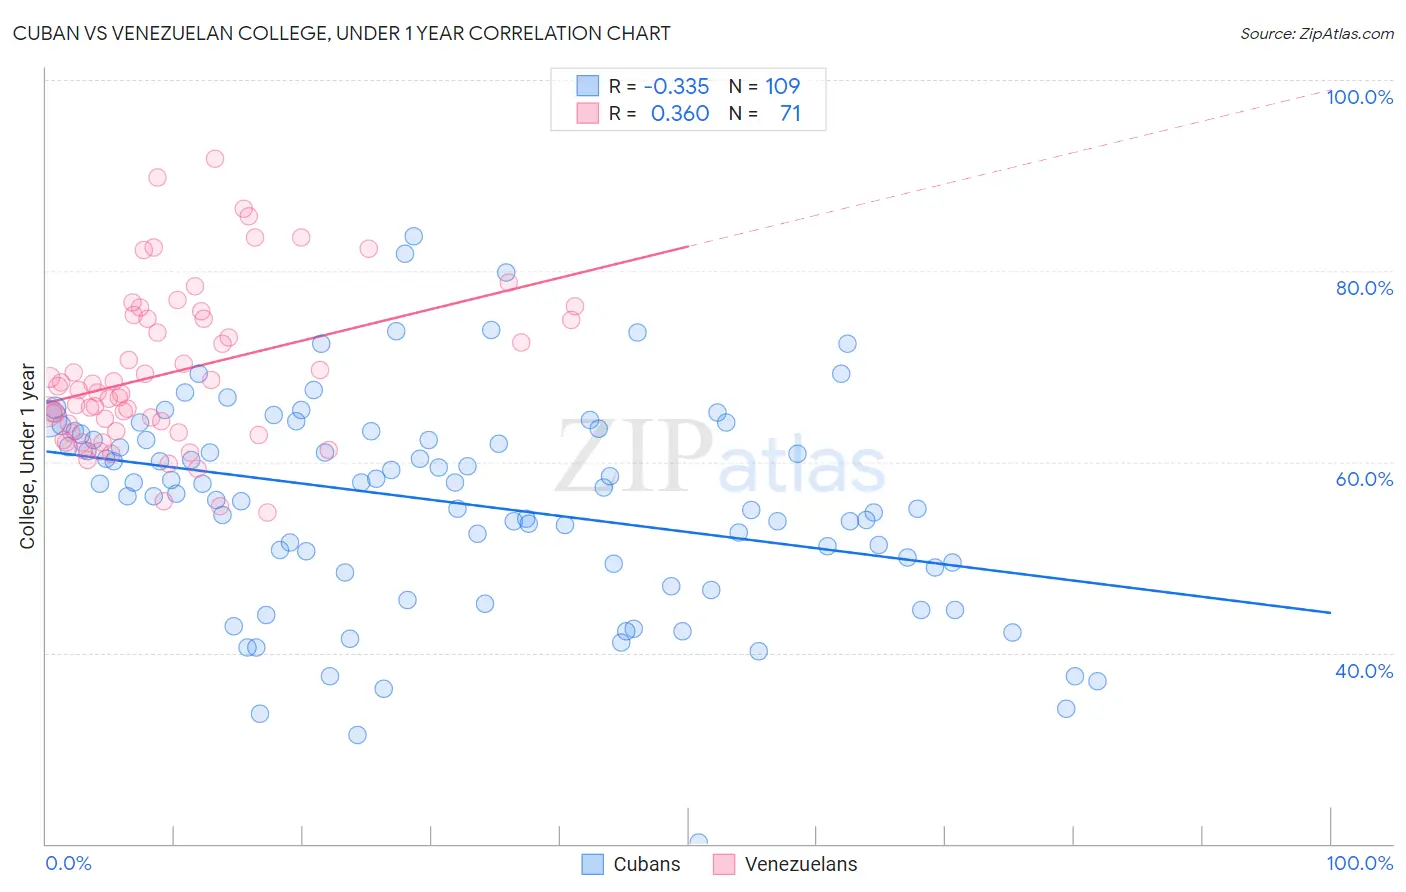
Cuban vs Venezuelan College, Under 1 year Correlation Chart
The statistical analysis conducted on geographies consisting of 449,373,028 people shows a mild negative correlation between the proportion of Cubans and percentage of population with at least college, under 1 year education in the United States with a correlation coefficient (R) of -0.335 and weighted average of 58.6%. Similarly, the statistical analysis conducted on geographies consisting of 306,323,601 people shows a mild positive correlation between the proportion of Venezuelans and percentage of population with at least college, under 1 year education in the United States with a correlation coefficient (R) of 0.360 and weighted average of 66.7%, a difference of 13.8%.
College, Under 1 year Correlation Summary
| Measurement | Cuban | Venezuelan |
| Minimum | 20.1% | 54.6% |
| Maximum | 83.6% | 91.7% |
| Range | 63.5% | 37.1% |
| Mean | 55.7% | 69.4% |
| Median | 57.3% | 67.5% |
| Interquartile 25% (IQ1) | 49.1% | 63.1% |
| Interquartile 75% (IQ3) | 63.0% | 75.1% |
| Interquartile Range (IQR) | 13.9% | 12.0% |
| Standard Deviation (Sample) | 11.1% | 8.3% |
| Standard Deviation (Population) | 11.1% | 8.2% |
Similar Demographics by College, Under 1 year
Demographics Similar to Cubans by College, Under 1 year
In terms of college, under 1 year, the demographic groups most similar to Cubans are Immigrants from Ecuador (58.7%, a difference of 0.13%), Immigrants from Guyana (58.5%, a difference of 0.26%), Guyanese (59.0%, a difference of 0.63%), Central American Indian (59.0%, a difference of 0.68%), and Immigrants from Grenada (59.1%, a difference of 0.72%).
| Demographics | Rating | Rank | College, Under 1 year |
| Nicaraguans | 0.0 /100 | #292 | Tragic 59.2% |
| Seminole | 0.0 /100 | #293 | Tragic 59.1% |
| Immigrants | Belize | 0.0 /100 | #294 | Tragic 59.1% |
| Immigrants | Grenada | 0.0 /100 | #295 | Tragic 59.1% |
| Central American Indians | 0.0 /100 | #296 | Tragic 59.0% |
| Guyanese | 0.0 /100 | #297 | Tragic 59.0% |
| Immigrants | Ecuador | 0.0 /100 | #298 | Tragic 58.7% |
| Cubans | 0.0 /100 | #299 | Tragic 58.6% |
| Immigrants | Guyana | 0.0 /100 | #300 | Tragic 58.5% |
| Mexican American Indians | 0.0 /100 | #301 | Tragic 58.1% |
| Apache | 0.0 /100 | #302 | Tragic 58.0% |
| Immigrants | Dominica | 0.0 /100 | #303 | Tragic 57.9% |
| Kiowa | 0.0 /100 | #304 | Tragic 57.8% |
| Haitians | 0.0 /100 | #305 | Tragic 57.8% |
| Immigrants | Portugal | 0.0 /100 | #306 | Tragic 57.7% |
Demographics Similar to Venezuelans by College, Under 1 year
In terms of college, under 1 year, the demographic groups most similar to Venezuelans are Slavic (66.7%, a difference of 0.0%), Immigrants from Afghanistan (66.7%, a difference of 0.070%), Immigrants from Italy (66.8%, a difference of 0.10%), Immigrants from Chile (66.8%, a difference of 0.14%), and Ugandan (66.8%, a difference of 0.18%).
| Demographics | Rating | Rank | College, Under 1 year |
| Poles | 88.4 /100 | #132 | Excellent 66.9% |
| Immigrants | Brazil | 88.3 /100 | #133 | Excellent 66.9% |
| Iraqis | 88.0 /100 | #134 | Excellent 66.8% |
| Canadians | 87.9 /100 | #135 | Excellent 66.8% |
| Ugandans | 87.8 /100 | #136 | Excellent 66.8% |
| Immigrants | Chile | 87.4 /100 | #137 | Excellent 66.8% |
| Immigrants | Italy | 86.9 /100 | #138 | Excellent 66.8% |
| Venezuelans | 85.9 /100 | #139 | Excellent 66.7% |
| Slavs | 85.9 /100 | #140 | Excellent 66.7% |
| Immigrants | Afghanistan | 85.1 /100 | #141 | Excellent 66.7% |
| English | 82.9 /100 | #142 | Excellent 66.6% |
| Immigrants | Uganda | 82.8 /100 | #143 | Excellent 66.5% |
| Immigrants | Germany | 82.0 /100 | #144 | Excellent 66.5% |
| Immigrants | Kenya | 81.8 /100 | #145 | Excellent 66.5% |
| Kenyans | 81.7 /100 | #146 | Excellent 66.5% |