Cuban vs Immigrants from Poland Doctorate Degree
COMPARE
Cuban
Immigrants from Poland
Doctorate Degree
Doctorate Degree Comparison
Cubans
Immigrants from Poland
1.4%
DOCTORATE DEGREE
0.1/ 100
METRIC RATING
307th/ 347
METRIC RANK
1.7%
DOCTORATE DEGREE
7.4/ 100
METRIC RATING
224th/ 347
METRIC RANK
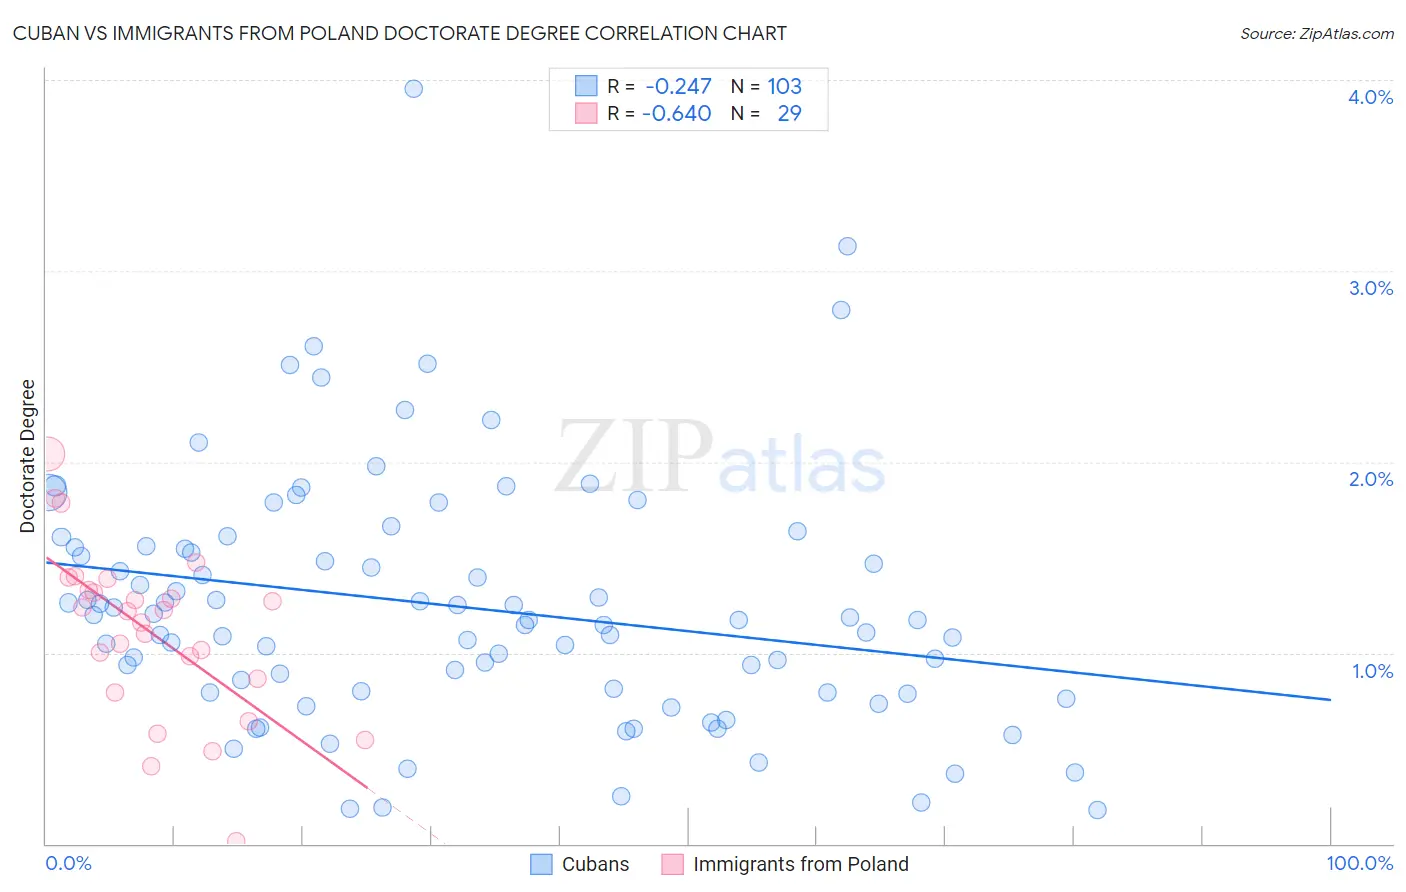
Cuban vs Immigrants from Poland Doctorate Degree Correlation Chart
The statistical analysis conducted on geographies consisting of 443,089,370 people shows a weak negative correlation between the proportion of Cubans and percentage of population with at least doctorate degree education in the United States with a correlation coefficient (R) of -0.247 and weighted average of 1.4%. Similarly, the statistical analysis conducted on geographies consisting of 303,139,955 people shows a significant negative correlation between the proportion of Immigrants from Poland and percentage of population with at least doctorate degree education in the United States with a correlation coefficient (R) of -0.640 and weighted average of 1.7%, a difference of 21.2%.
Doctorate Degree Correlation Summary
| Measurement | Cuban | Immigrants from Poland |
| Minimum | 0.18% | 0.013% |
| Maximum | 4.0% | 2.0% |
| Range | 3.8% | 2.0% |
| Mean | 1.2% | 1.1% |
| Median | 1.2% | 1.2% |
| Interquartile 25% (IQ1) | 0.79% | 0.83% |
| Interquartile 75% (IQ3) | 1.6% | 1.4% |
| Interquartile Range (IQR) | 0.76% | 0.53% |
| Standard Deviation (Sample) | 0.65% | 0.44% |
| Standard Deviation (Population) | 0.65% | 0.44% |
Similar Demographics by Doctorate Degree
Demographics Similar to Cubans by Doctorate Degree
In terms of doctorate degree, the demographic groups most similar to Cubans are Immigrants from Laos (1.4%, a difference of 0.050%), Guyanese (1.4%, a difference of 0.25%), Pennsylvania German (1.4%, a difference of 0.26%), Mexican American Indian (1.4%, a difference of 0.40%), and Immigrants from Dominica (1.4%, a difference of 0.45%).
| Demographics | Rating | Rank | Doctorate Degree |
| Immigrants | Guatemala | 0.1 /100 | #300 | Tragic 1.4% |
| Hondurans | 0.1 /100 | #301 | Tragic 1.4% |
| Shoshone | 0.1 /100 | #302 | Tragic 1.4% |
| Immigrants | Dominica | 0.1 /100 | #303 | Tragic 1.4% |
| Mexican American Indians | 0.1 /100 | #304 | Tragic 1.4% |
| Pennsylvania Germans | 0.1 /100 | #305 | Tragic 1.4% |
| Guyanese | 0.1 /100 | #306 | Tragic 1.4% |
| Cubans | 0.1 /100 | #307 | Tragic 1.4% |
| Immigrants | Laos | 0.1 /100 | #308 | Tragic 1.4% |
| Immigrants | Grenada | 0.1 /100 | #309 | Tragic 1.4% |
| Immigrants | Jamaica | 0.1 /100 | #310 | Tragic 1.4% |
| Immigrants | Honduras | 0.1 /100 | #311 | Tragic 1.4% |
| Immigrants | Nicaragua | 0.1 /100 | #312 | Tragic 1.4% |
| Menominee | 0.1 /100 | #313 | Tragic 1.4% |
| Dominicans | 0.1 /100 | #314 | Tragic 1.4% |
Demographics Similar to Immigrants from Poland by Doctorate Degree
In terms of doctorate degree, the demographic groups most similar to Immigrants from Poland are Immigrants from Bosnia and Herzegovina (1.7%, a difference of 0.22%), Immigrants from Colombia (1.7%, a difference of 0.49%), Osage (1.7%, a difference of 0.61%), Immigrants from Venezuela (1.7%, a difference of 0.68%), and Nonimmigrants (1.7%, a difference of 0.75%).
| Demographics | Rating | Rank | Doctorate Degree |
| Spanish Americans | 12.9 /100 | #217 | Poor 1.7% |
| Tlingit-Haida | 11.9 /100 | #218 | Poor 1.7% |
| Immigrants | Iraq | 10.7 /100 | #219 | Poor 1.7% |
| Immigrants | Uruguay | 9.2 /100 | #220 | Tragic 1.7% |
| Immigrants | Nonimmigrants | 8.8 /100 | #221 | Tragic 1.7% |
| Immigrants | Venezuela | 8.7 /100 | #222 | Tragic 1.7% |
| Immigrants | Bosnia and Herzegovina | 7.8 /100 | #223 | Tragic 1.7% |
| Immigrants | Poland | 7.4 /100 | #224 | Tragic 1.7% |
| Immigrants | Colombia | 6.7 /100 | #225 | Tragic 1.7% |
| Osage | 6.5 /100 | #226 | Tragic 1.7% |
| Panamanians | 6.3 /100 | #227 | Tragic 1.7% |
| Assyrians/Chaldeans/Syriacs | 5.9 /100 | #228 | Tragic 1.7% |
| Colville | 4.7 /100 | #229 | Tragic 1.6% |
| Immigrants | Philippines | 4.3 /100 | #230 | Tragic 1.6% |
| Immigrants | North Macedonia | 3.9 /100 | #231 | Tragic 1.6% |