Cuban vs Houma 2 or more Vehicles in Household
COMPARE
Cuban
Houma
2 or more Vehicles in Household
2 or more Vehicles in Household Comparison
Cubans
Houma
56.3%
2 OR MORE VEHICLES IN HOUSEHOLD
84.8/ 100
METRIC RATING
137th/ 347
METRIC RANK
54.4%
2 OR MORE VEHICLES IN HOUSEHOLD
15.8/ 100
METRIC RATING
200th/ 347
METRIC RANK
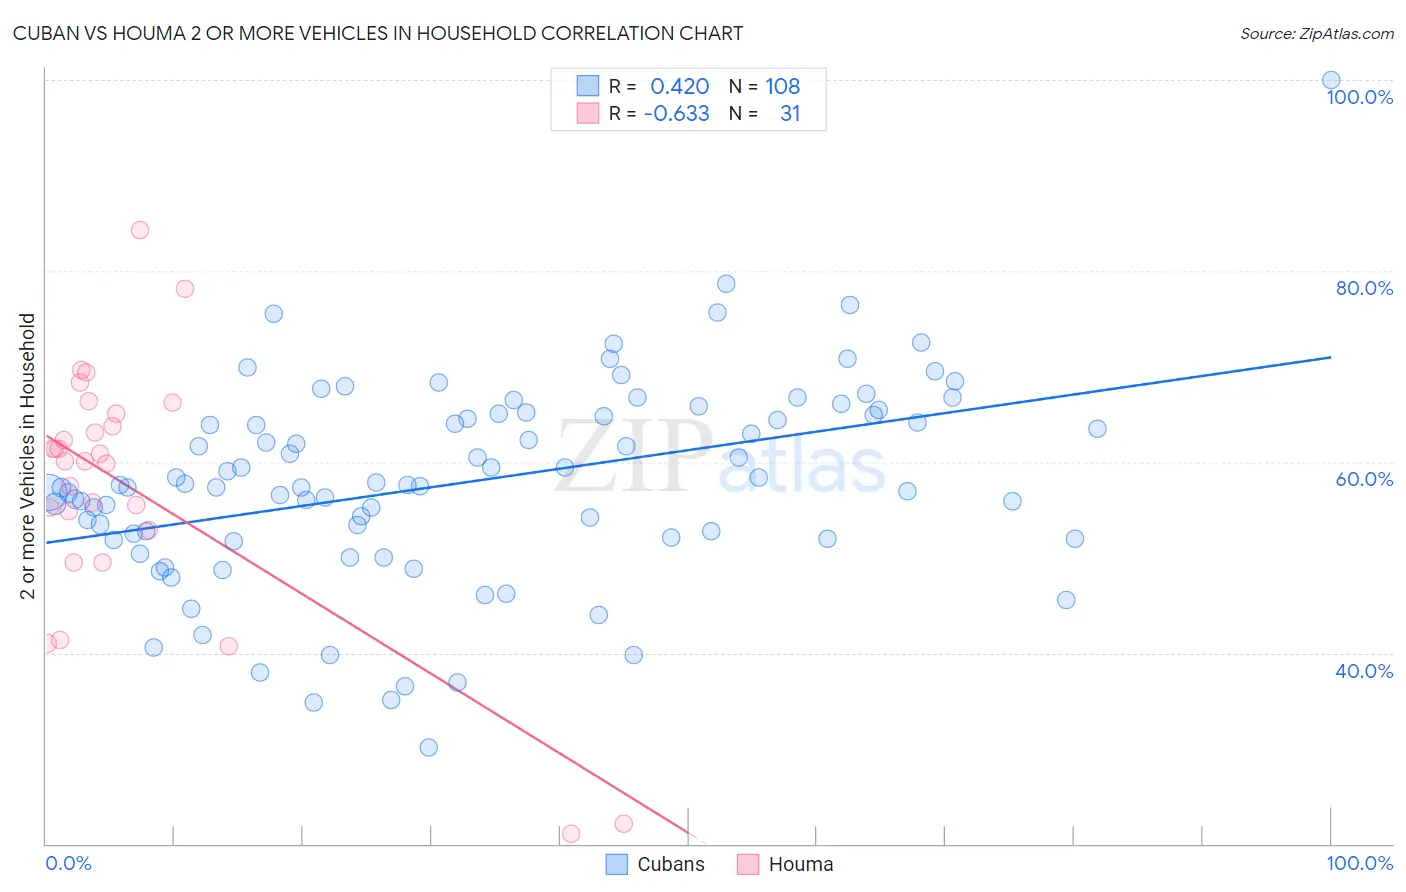
Cuban vs Houma 2 or more Vehicles in Household Correlation Chart
The statistical analysis conducted on geographies consisting of 448,997,187 people shows a moderate positive correlation between the proportion of Cubans and percentage of households with 2 or more vehicles available in the United States with a correlation coefficient (R) of 0.420 and weighted average of 56.3%. Similarly, the statistical analysis conducted on geographies consisting of 36,796,778 people shows a significant negative correlation between the proportion of Houma and percentage of households with 2 or more vehicles available in the United States with a correlation coefficient (R) of -0.633 and weighted average of 54.4%, a difference of 3.4%.
2 or more Vehicles in Household Correlation Summary
| Measurement | Cuban | Houma |
| Minimum | 30.1% | 21.1% |
| Maximum | 100.0% | 84.3% |
| Range | 69.9% | 63.2% |
| Mean | 57.8% | 57.4% |
| Median | 57.5% | 60.1% |
| Interquartile 25% (IQ1) | 52.0% | 52.8% |
| Interquartile 75% (IQ3) | 64.9% | 65.0% |
| Interquartile Range (IQR) | 12.8% | 12.2% |
| Standard Deviation (Sample) | 10.6% | 13.5% |
| Standard Deviation (Population) | 10.6% | 13.3% |
Similar Demographics by 2 or more Vehicles in Household
Demographics Similar to Cubans by 2 or more Vehicles in Household
In terms of 2 or more vehicles in household, the demographic groups most similar to Cubans are Salvadoran (56.3%, a difference of 0.010%), Armenian (56.3%, a difference of 0.040%), Immigrants from Asia (56.3%, a difference of 0.090%), Latvian (56.2%, a difference of 0.090%), and Immigrants from Cambodia (56.2%, a difference of 0.090%).
| Demographics | Rating | Rank | 2 or more Vehicles in Household |
| Yugoslavians | 90.0 /100 | #130 | Exceptional 56.6% |
| Bulgarians | 89.7 /100 | #131 | Excellent 56.5% |
| Hungarians | 89.1 /100 | #132 | Excellent 56.5% |
| Comanche | 88.4 /100 | #133 | Excellent 56.5% |
| Immigrants | Azores | 86.6 /100 | #134 | Excellent 56.4% |
| Blackfeet | 86.5 /100 | #135 | Excellent 56.4% |
| Immigrants | Asia | 86.0 /100 | #136 | Excellent 56.3% |
| Cubans | 84.8 /100 | #137 | Excellent 56.3% |
| Salvadorans | 84.7 /100 | #138 | Excellent 56.3% |
| Armenians | 84.3 /100 | #139 | Excellent 56.3% |
| Latvians | 83.6 /100 | #140 | Excellent 56.2% |
| Immigrants | Cambodia | 83.6 /100 | #141 | Excellent 56.2% |
| South Africans | 83.1 /100 | #142 | Excellent 56.2% |
| Seminole | 81.7 /100 | #143 | Excellent 56.2% |
| Immigrants | Syria | 81.4 /100 | #144 | Excellent 56.2% |
Demographics Similar to Houma by 2 or more Vehicles in Household
In terms of 2 or more vehicles in household, the demographic groups most similar to Houma are Immigrants from Norway (54.4%, a difference of 0.0%), Carpatho Rusyn (54.4%, a difference of 0.030%), Immigrants from Italy (54.4%, a difference of 0.030%), Immigrants from North Macedonia (54.4%, a difference of 0.070%), and Argentinean (54.5%, a difference of 0.12%).
| Demographics | Rating | Rank | 2 or more Vehicles in Household |
| Immigrants | Japan | 23.4 /100 | #193 | Fair 54.7% |
| Central Americans | 23.0 /100 | #194 | Fair 54.7% |
| Iroquois | 22.6 /100 | #195 | Fair 54.7% |
| Immigrants | Poland | 19.3 /100 | #196 | Poor 54.6% |
| Argentineans | 17.5 /100 | #197 | Poor 54.5% |
| Carpatho Rusyns | 16.2 /100 | #198 | Poor 54.4% |
| Immigrants | Norway | 15.9 /100 | #199 | Poor 54.4% |
| Houma | 15.8 /100 | #200 | Poor 54.4% |
| Immigrants | Italy | 15.5 /100 | #201 | Poor 54.4% |
| Immigrants | North Macedonia | 14.9 /100 | #202 | Poor 54.4% |
| Immigrants | Peru | 14.3 /100 | #203 | Poor 54.4% |
| Immigrants | Belgium | 13.7 /100 | #204 | Poor 54.3% |
| Cheyenne | 13.6 /100 | #205 | Poor 54.3% |
| Immigrants | Latin America | 13.1 /100 | #206 | Poor 54.3% |
| Turks | 13.0 /100 | #207 | Poor 54.3% |