Immigrants from Southern Europe vs Houma 2 or more Vehicles in Household
COMPARE
Immigrants from Southern Europe
Houma
2 or more Vehicles in Household
2 or more Vehicles in Household Comparison
Immigrants from Southern Europe
Houma
52.3%
2 OR MORE VEHICLES IN HOUSEHOLD
0.4/ 100
METRIC RATING
263rd/ 347
METRIC RANK
54.4%
2 OR MORE VEHICLES IN HOUSEHOLD
15.8/ 100
METRIC RATING
200th/ 347
METRIC RANK
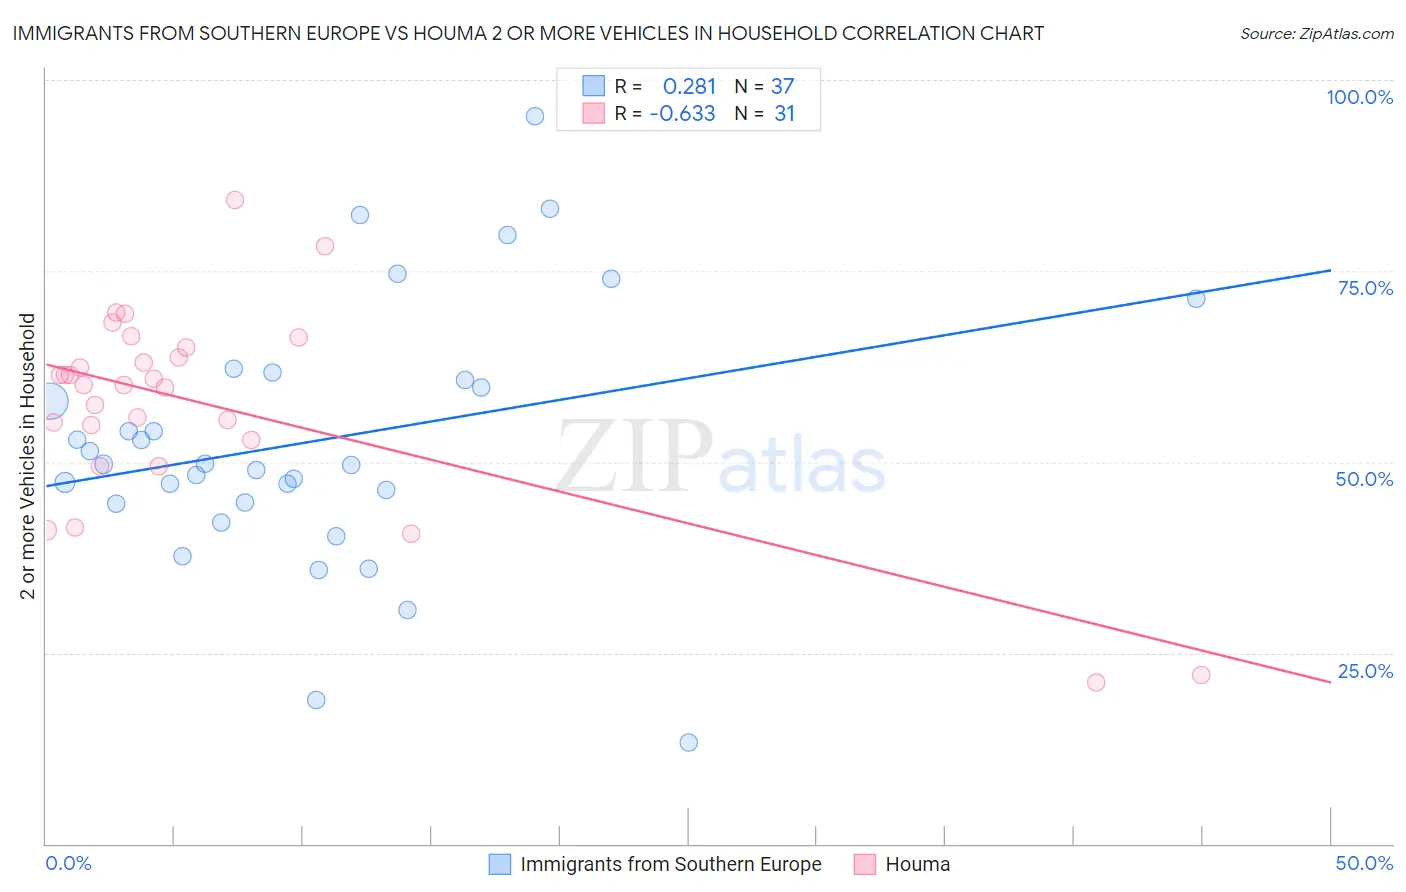
Immigrants from Southern Europe vs Houma 2 or more Vehicles in Household Correlation Chart
The statistical analysis conducted on geographies consisting of 402,657,481 people shows a weak positive correlation between the proportion of Immigrants from Southern Europe and percentage of households with 2 or more vehicles available in the United States with a correlation coefficient (R) of 0.281 and weighted average of 52.3%. Similarly, the statistical analysis conducted on geographies consisting of 36,796,778 people shows a significant negative correlation between the proportion of Houma and percentage of households with 2 or more vehicles available in the United States with a correlation coefficient (R) of -0.633 and weighted average of 54.4%, a difference of 4.1%.
2 or more Vehicles in Household Correlation Summary
| Measurement | Immigrants from Southern Europe | Houma |
| Minimum | 13.2% | 21.1% |
| Maximum | 95.2% | 84.3% |
| Range | 82.0% | 63.2% |
| Mean | 52.8% | 57.4% |
| Median | 49.7% | 60.1% |
| Interquartile 25% (IQ1) | 44.6% | 52.8% |
| Interquartile 75% (IQ3) | 61.2% | 65.0% |
| Interquartile Range (IQR) | 16.6% | 12.2% |
| Standard Deviation (Sample) | 17.1% | 13.5% |
| Standard Deviation (Population) | 16.9% | 13.3% |
Similar Demographics by 2 or more Vehicles in Household
Demographics Similar to Immigrants from Southern Europe by 2 or more Vehicles in Household
In terms of 2 or more vehicles in household, the demographic groups most similar to Immigrants from Southern Europe are Immigrants from Latvia (52.2%, a difference of 0.040%), Immigrants from Northern Africa (52.3%, a difference of 0.13%), Immigrants from Congo (52.1%, a difference of 0.28%), Immigrants from Australia (52.4%, a difference of 0.33%), and Immigrants from Bahamas (52.5%, a difference of 0.36%).
| Demographics | Rating | Rank | 2 or more Vehicles in Household |
| Immigrants | Eritrea | 0.7 /100 | #256 | Tragic 52.6% |
| Immigrants | Hong Kong | 0.6 /100 | #257 | Tragic 52.6% |
| Central American Indians | 0.6 /100 | #258 | Tragic 52.5% |
| Alsatians | 0.6 /100 | #259 | Tragic 52.5% |
| Immigrants | Bahamas | 0.5 /100 | #260 | Tragic 52.5% |
| Immigrants | Australia | 0.5 /100 | #261 | Tragic 52.4% |
| Immigrants | Northern Africa | 0.4 /100 | #262 | Tragic 52.3% |
| Immigrants | Southern Europe | 0.4 /100 | #263 | Tragic 52.3% |
| Immigrants | Latvia | 0.4 /100 | #264 | Tragic 52.2% |
| Immigrants | Congo | 0.3 /100 | #265 | Tragic 52.1% |
| Immigrants | France | 0.2 /100 | #266 | Tragic 52.0% |
| Immigrants | Colombia | 0.2 /100 | #267 | Tragic 52.0% |
| Pima | 0.2 /100 | #268 | Tragic 52.0% |
| Hondurans | 0.2 /100 | #269 | Tragic 52.0% |
| Immigrants | Ireland | 0.2 /100 | #270 | Tragic 52.0% |
Demographics Similar to Houma by 2 or more Vehicles in Household
In terms of 2 or more vehicles in household, the demographic groups most similar to Houma are Immigrants from Norway (54.4%, a difference of 0.0%), Carpatho Rusyn (54.4%, a difference of 0.030%), Immigrants from Italy (54.4%, a difference of 0.030%), Immigrants from North Macedonia (54.4%, a difference of 0.070%), and Argentinean (54.5%, a difference of 0.12%).
| Demographics | Rating | Rank | 2 or more Vehicles in Household |
| Immigrants | Japan | 23.4 /100 | #193 | Fair 54.7% |
| Central Americans | 23.0 /100 | #194 | Fair 54.7% |
| Iroquois | 22.6 /100 | #195 | Fair 54.7% |
| Immigrants | Poland | 19.3 /100 | #196 | Poor 54.6% |
| Argentineans | 17.5 /100 | #197 | Poor 54.5% |
| Carpatho Rusyns | 16.2 /100 | #198 | Poor 54.4% |
| Immigrants | Norway | 15.9 /100 | #199 | Poor 54.4% |
| Houma | 15.8 /100 | #200 | Poor 54.4% |
| Immigrants | Italy | 15.5 /100 | #201 | Poor 54.4% |
| Immigrants | North Macedonia | 14.9 /100 | #202 | Poor 54.4% |
| Immigrants | Peru | 14.3 /100 | #203 | Poor 54.4% |
| Immigrants | Belgium | 13.7 /100 | #204 | Poor 54.3% |
| Cheyenne | 13.6 /100 | #205 | Poor 54.3% |
| Immigrants | Latin America | 13.1 /100 | #206 | Poor 54.3% |
| Turks | 13.0 /100 | #207 | Poor 54.3% |