Jamaican vs Houma 2 or more Vehicles in Household
COMPARE
Jamaican
Houma
2 or more Vehicles in Household
2 or more Vehicles in Household Comparison
Jamaicans
Houma
45.8%
2 OR MORE VEHICLES IN HOUSEHOLD
0.0/ 100
METRIC RATING
319th/ 347
METRIC RANK
54.4%
2 OR MORE VEHICLES IN HOUSEHOLD
15.8/ 100
METRIC RATING
200th/ 347
METRIC RANK
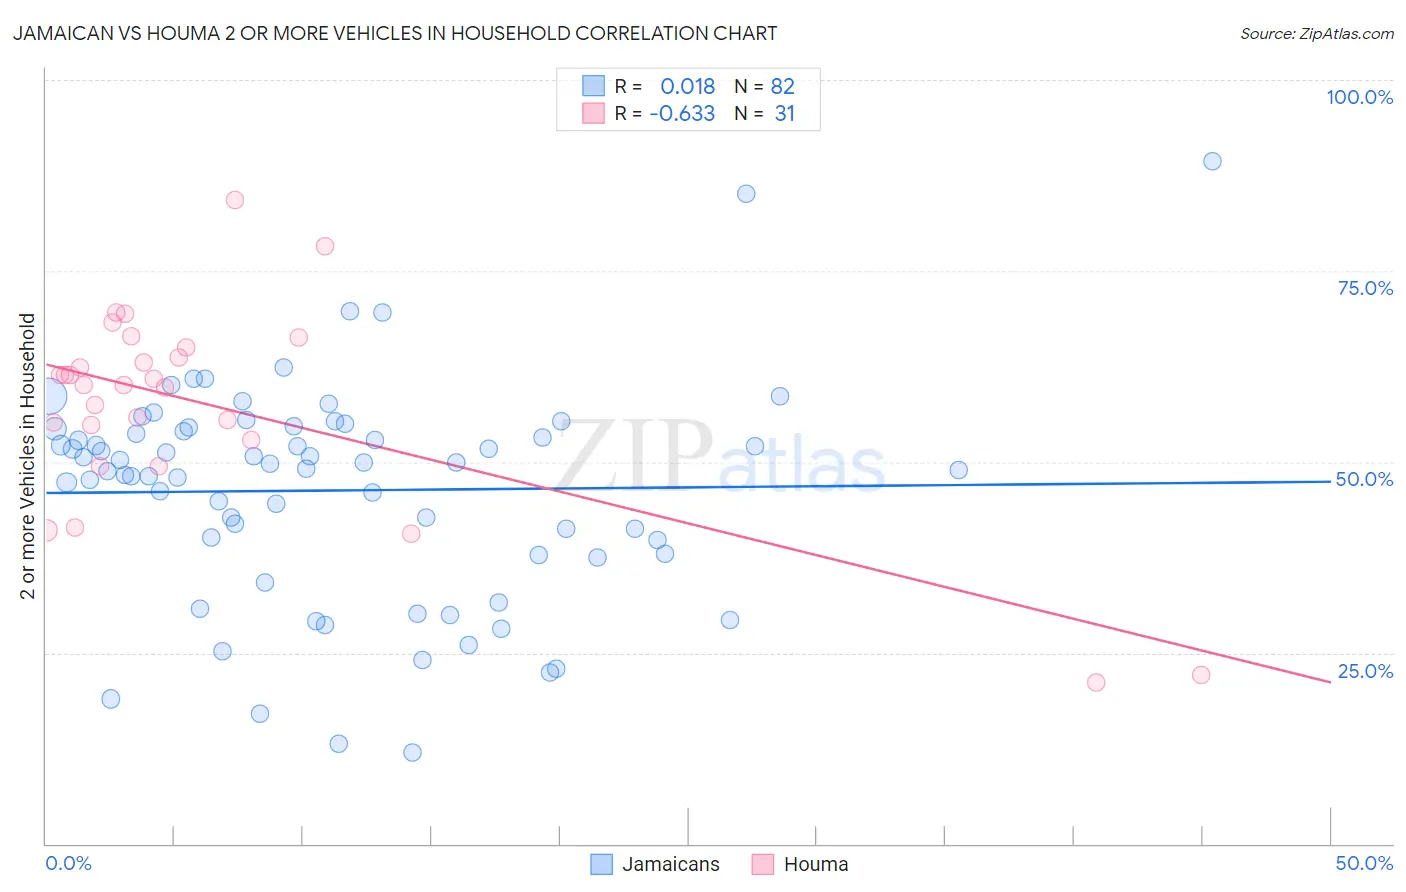
Jamaican vs Houma 2 or more Vehicles in Household Correlation Chart
The statistical analysis conducted on geographies consisting of 367,700,586 people shows no correlation between the proportion of Jamaicans and percentage of households with 2 or more vehicles available in the United States with a correlation coefficient (R) of 0.018 and weighted average of 45.8%. Similarly, the statistical analysis conducted on geographies consisting of 36,796,778 people shows a significant negative correlation between the proportion of Houma and percentage of households with 2 or more vehicles available in the United States with a correlation coefficient (R) of -0.633 and weighted average of 54.4%, a difference of 18.9%.
2 or more Vehicles in Household Correlation Summary
| Measurement | Jamaican | Houma |
| Minimum | 12.0% | 21.1% |
| Maximum | 89.3% | 84.3% |
| Range | 77.3% | 63.2% |
| Mean | 46.3% | 57.4% |
| Median | 49.4% | 60.1% |
| Interquartile 25% (IQ1) | 38.0% | 52.8% |
| Interquartile 75% (IQ3) | 54.3% | 65.0% |
| Interquartile Range (IQR) | 16.3% | 12.2% |
| Standard Deviation (Sample) | 14.2% | 13.5% |
| Standard Deviation (Population) | 14.1% | 13.3% |
Similar Demographics by 2 or more Vehicles in Household
Demographics Similar to Jamaicans by 2 or more Vehicles in Household
In terms of 2 or more vehicles in household, the demographic groups most similar to Jamaicans are Soviet Union (45.7%, a difference of 0.060%), Immigrants from Albania (46.0%, a difference of 0.52%), Immigrants from Haiti (46.5%, a difference of 1.7%), Cape Verdean (46.8%, a difference of 2.2%), and Puerto Rican (47.1%, a difference of 2.9%).
| Demographics | Rating | Rank | 2 or more Vehicles in Household |
| Haitians | 0.0 /100 | #312 | Tragic 47.6% |
| U.S. Virgin Islanders | 0.0 /100 | #313 | Tragic 47.5% |
| Immigrants | Ghana | 0.0 /100 | #314 | Tragic 47.4% |
| Puerto Ricans | 0.0 /100 | #315 | Tragic 47.1% |
| Cape Verdeans | 0.0 /100 | #316 | Tragic 46.8% |
| Immigrants | Haiti | 0.0 /100 | #317 | Tragic 46.5% |
| Immigrants | Albania | 0.0 /100 | #318 | Tragic 46.0% |
| Jamaicans | 0.0 /100 | #319 | Tragic 45.8% |
| Soviet Union | 0.0 /100 | #320 | Tragic 45.7% |
| Immigrants | Jamaica | 0.0 /100 | #321 | Tragic 44.5% |
| Senegalese | 0.0 /100 | #322 | Tragic 44.2% |
| Immigrants | Caribbean | 0.0 /100 | #323 | Tragic 44.2% |
| Immigrants | Cabo Verde | 0.0 /100 | #324 | Tragic 43.3% |
| Immigrants | West Indies | 0.0 /100 | #325 | Tragic 43.1% |
| Immigrants | Senegal | 0.0 /100 | #326 | Tragic 43.0% |
Demographics Similar to Houma by 2 or more Vehicles in Household
In terms of 2 or more vehicles in household, the demographic groups most similar to Houma are Immigrants from Norway (54.4%, a difference of 0.0%), Carpatho Rusyn (54.4%, a difference of 0.030%), Immigrants from Italy (54.4%, a difference of 0.030%), Immigrants from North Macedonia (54.4%, a difference of 0.070%), and Argentinean (54.5%, a difference of 0.12%).
| Demographics | Rating | Rank | 2 or more Vehicles in Household |
| Immigrants | Japan | 23.4 /100 | #193 | Fair 54.7% |
| Central Americans | 23.0 /100 | #194 | Fair 54.7% |
| Iroquois | 22.6 /100 | #195 | Fair 54.7% |
| Immigrants | Poland | 19.3 /100 | #196 | Poor 54.6% |
| Argentineans | 17.5 /100 | #197 | Poor 54.5% |
| Carpatho Rusyns | 16.2 /100 | #198 | Poor 54.4% |
| Immigrants | Norway | 15.9 /100 | #199 | Poor 54.4% |
| Houma | 15.8 /100 | #200 | Poor 54.4% |
| Immigrants | Italy | 15.5 /100 | #201 | Poor 54.4% |
| Immigrants | North Macedonia | 14.9 /100 | #202 | Poor 54.4% |
| Immigrants | Peru | 14.3 /100 | #203 | Poor 54.4% |
| Immigrants | Belgium | 13.7 /100 | #204 | Poor 54.3% |
| Cheyenne | 13.6 /100 | #205 | Poor 54.3% |
| Immigrants | Latin America | 13.1 /100 | #206 | Poor 54.3% |
| Turks | 13.0 /100 | #207 | Poor 54.3% |