Cuban vs Paraguayan 2 or more Vehicles in Household
COMPARE
Cuban
Paraguayan
2 or more Vehicles in Household
2 or more Vehicles in Household Comparison
Cubans
Paraguayans
56.3%
2 OR MORE VEHICLES IN HOUSEHOLD
84.8/ 100
METRIC RATING
137th/ 347
METRIC RANK
50.3%
2 OR MORE VEHICLES IN HOUSEHOLD
0.0/ 100
METRIC RATING
298th/ 347
METRIC RANK
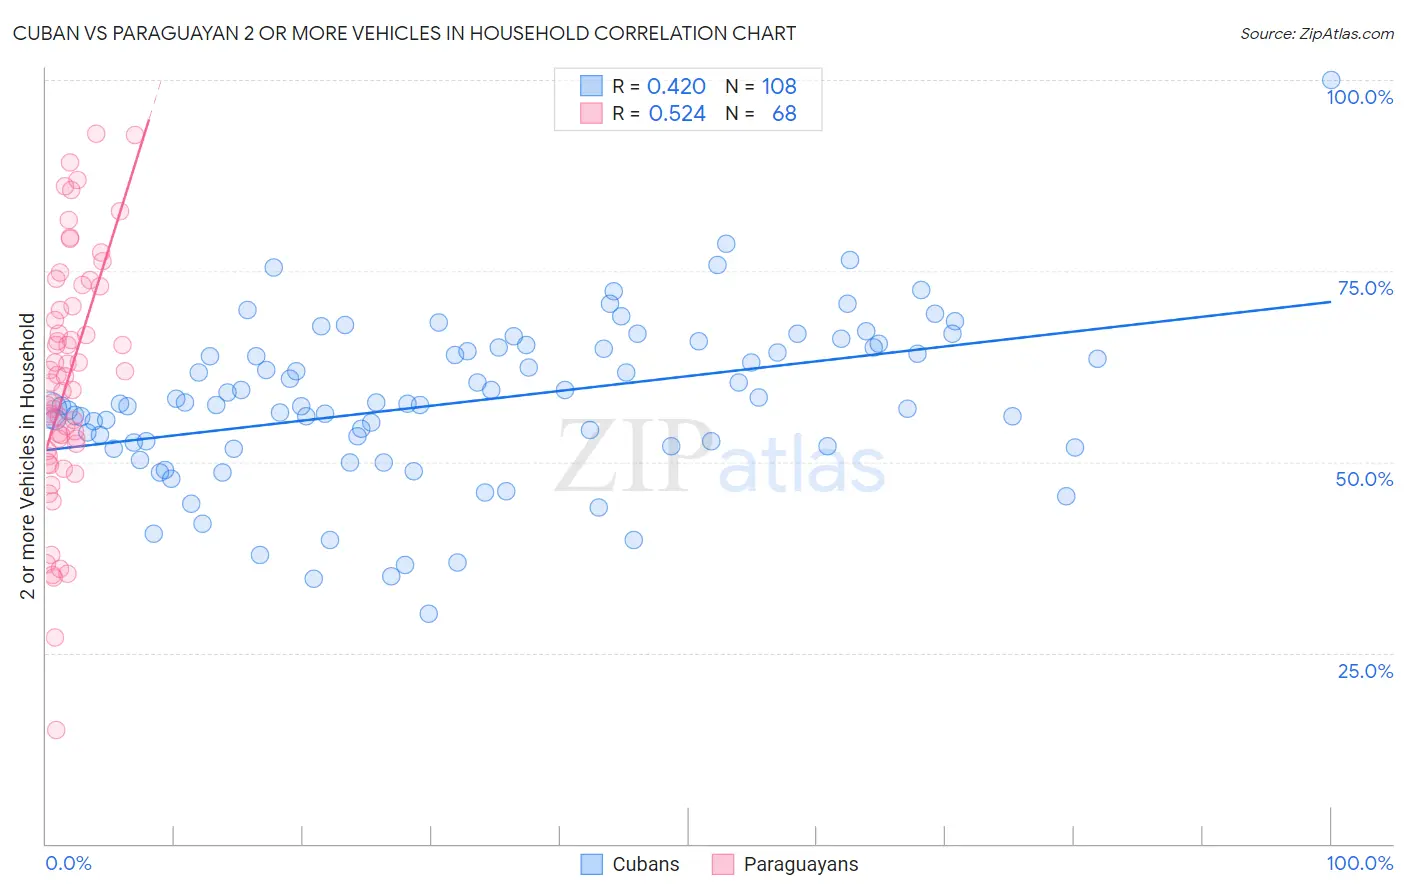
Cuban vs Paraguayan 2 or more Vehicles in Household Correlation Chart
The statistical analysis conducted on geographies consisting of 448,997,187 people shows a moderate positive correlation between the proportion of Cubans and percentage of households with 2 or more vehicles available in the United States with a correlation coefficient (R) of 0.420 and weighted average of 56.3%. Similarly, the statistical analysis conducted on geographies consisting of 95,096,913 people shows a substantial positive correlation between the proportion of Paraguayans and percentage of households with 2 or more vehicles available in the United States with a correlation coefficient (R) of 0.524 and weighted average of 50.3%, a difference of 11.8%.
2 or more Vehicles in Household Correlation Summary
| Measurement | Cuban | Paraguayan |
| Minimum | 30.1% | 15.0% |
| Maximum | 100.0% | 93.0% |
| Range | 69.9% | 78.0% |
| Mean | 57.8% | 60.7% |
| Median | 57.5% | 60.8% |
| Interquartile 25% (IQ1) | 52.0% | 52.0% |
| Interquartile 75% (IQ3) | 64.9% | 71.7% |
| Interquartile Range (IQR) | 12.8% | 19.7% |
| Standard Deviation (Sample) | 10.6% | 16.0% |
| Standard Deviation (Population) | 10.6% | 15.8% |
Similar Demographics by 2 or more Vehicles in Household
Demographics Similar to Cubans by 2 or more Vehicles in Household
In terms of 2 or more vehicles in household, the demographic groups most similar to Cubans are Salvadoran (56.3%, a difference of 0.010%), Armenian (56.3%, a difference of 0.040%), Immigrants from Asia (56.3%, a difference of 0.090%), Latvian (56.2%, a difference of 0.090%), and Immigrants from Cambodia (56.2%, a difference of 0.090%).
| Demographics | Rating | Rank | 2 or more Vehicles in Household |
| Yugoslavians | 90.0 /100 | #130 | Exceptional 56.6% |
| Bulgarians | 89.7 /100 | #131 | Excellent 56.5% |
| Hungarians | 89.1 /100 | #132 | Excellent 56.5% |
| Comanche | 88.4 /100 | #133 | Excellent 56.5% |
| Immigrants | Azores | 86.6 /100 | #134 | Excellent 56.4% |
| Blackfeet | 86.5 /100 | #135 | Excellent 56.4% |
| Immigrants | Asia | 86.0 /100 | #136 | Excellent 56.3% |
| Cubans | 84.8 /100 | #137 | Excellent 56.3% |
| Salvadorans | 84.7 /100 | #138 | Excellent 56.3% |
| Armenians | 84.3 /100 | #139 | Excellent 56.3% |
| Latvians | 83.6 /100 | #140 | Excellent 56.2% |
| Immigrants | Cambodia | 83.6 /100 | #141 | Excellent 56.2% |
| South Africans | 83.1 /100 | #142 | Excellent 56.2% |
| Seminole | 81.7 /100 | #143 | Excellent 56.2% |
| Immigrants | Syria | 81.4 /100 | #144 | Excellent 56.2% |
Demographics Similar to Paraguayans by 2 or more Vehicles in Household
In terms of 2 or more vehicles in household, the demographic groups most similar to Paraguayans are Immigrants from Morocco (50.3%, a difference of 0.030%), Immigrants from Russia (50.3%, a difference of 0.070%), Immigrants from Spain (50.4%, a difference of 0.13%), Immigrants from Greece (50.2%, a difference of 0.25%), and Immigrants from South America (50.2%, a difference of 0.31%).
| Demographics | Rating | Rank | 2 or more Vehicles in Household |
| Belizeans | 0.0 /100 | #291 | Tragic 51.0% |
| Immigrants | Ukraine | 0.0 /100 | #292 | Tragic 50.9% |
| Blacks/African Americans | 0.0 /100 | #293 | Tragic 50.9% |
| Bermudans | 0.0 /100 | #294 | Tragic 50.6% |
| Cypriots | 0.0 /100 | #295 | Tragic 50.6% |
| Immigrants | Somalia | 0.0 /100 | #296 | Tragic 50.5% |
| Immigrants | Spain | 0.0 /100 | #297 | Tragic 50.4% |
| Paraguayans | 0.0 /100 | #298 | Tragic 50.3% |
| Immigrants | Morocco | 0.0 /100 | #299 | Tragic 50.3% |
| Immigrants | Russia | 0.0 /100 | #300 | Tragic 50.3% |
| Immigrants | Greece | 0.0 /100 | #301 | Tragic 50.2% |
| Immigrants | South America | 0.0 /100 | #302 | Tragic 50.2% |
| Tohono O'odham | 0.0 /100 | #303 | Tragic 50.0% |
| Immigrants | Belize | 0.0 /100 | #304 | Tragic 49.9% |
| Immigrants | Western Africa | 0.0 /100 | #305 | Tragic 49.4% |