Cuban vs Houma Seniors Poverty Over the Age of 75
COMPARE
Cuban
Houma
Seniors Poverty Over the Age of 75
Seniors Poverty Over the Age of 75 Comparison
Cubans
Houma
18.0%
SENIORS POVERTY OVER THE AGE OF 75
0.0/ 100
METRIC RATING
335th/ 347
METRIC RANK
16.2%
SENIORS POVERTY OVER THE AGE OF 75
0.0/ 100
METRIC RATING
318th/ 347
METRIC RANK
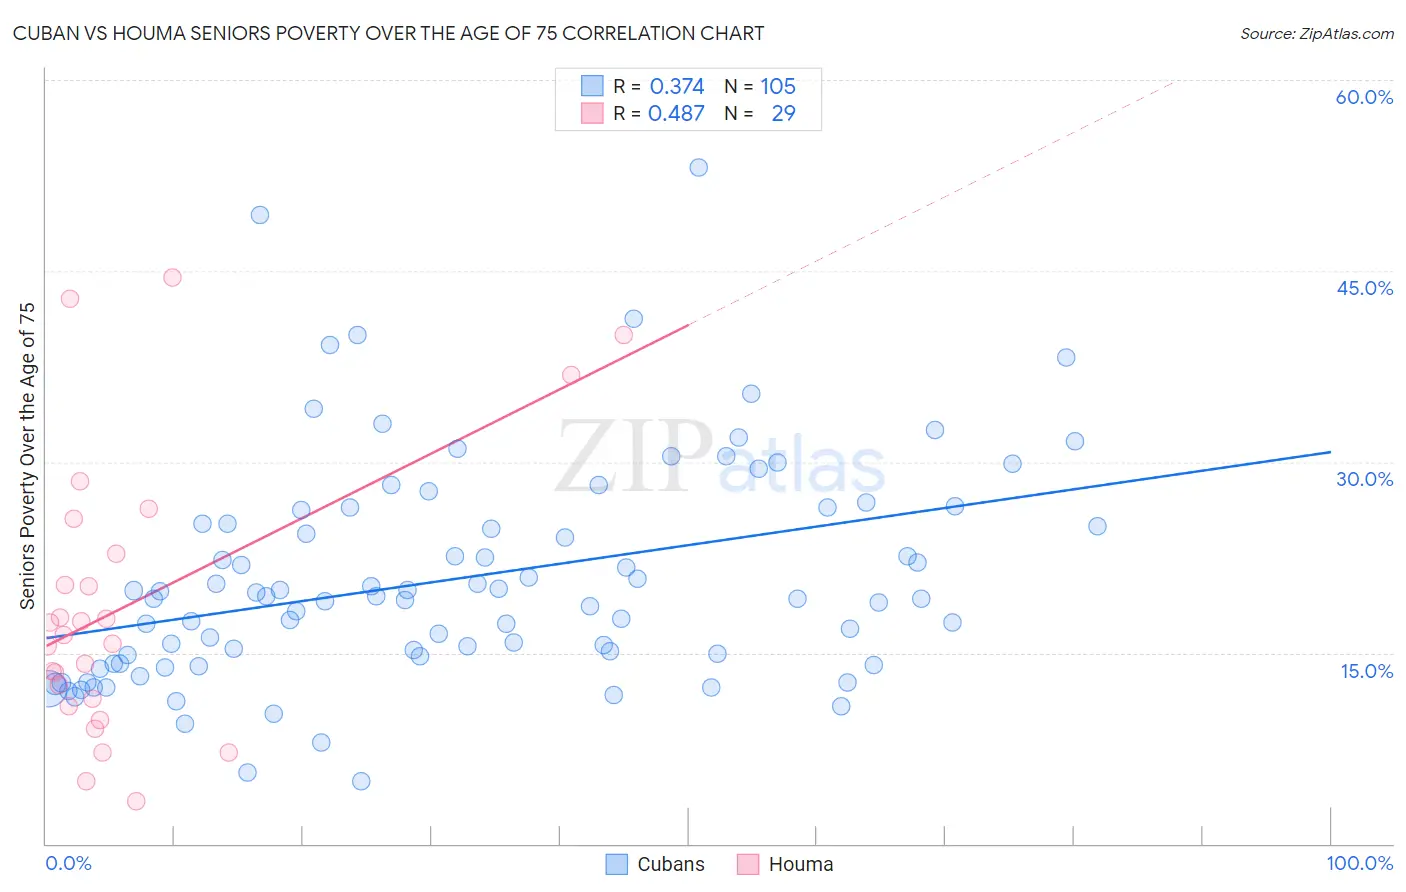
Cuban vs Houma Seniors Poverty Over the Age of 75 Correlation Chart
The statistical analysis conducted on geographies consisting of 443,347,202 people shows a mild positive correlation between the proportion of Cubans and poverty level among seniors over the age of 75 in the United States with a correlation coefficient (R) of 0.374 and weighted average of 18.0%. Similarly, the statistical analysis conducted on geographies consisting of 36,627,253 people shows a moderate positive correlation between the proportion of Houma and poverty level among seniors over the age of 75 in the United States with a correlation coefficient (R) of 0.487 and weighted average of 16.2%, a difference of 10.5%.
Seniors Poverty Over the Age of 75 Correlation Summary
| Measurement | Cuban | Houma |
| Minimum | 4.9% | 3.3% |
| Maximum | 53.2% | 44.5% |
| Range | 48.3% | 41.2% |
| Mean | 20.8% | 18.7% |
| Median | 19.2% | 16.4% |
| Interquartile 25% (IQ1) | 14.5% | 11.1% |
| Interquartile 75% (IQ3) | 25.7% | 24.2% |
| Interquartile Range (IQR) | 11.2% | 13.1% |
| Standard Deviation (Sample) | 8.7% | 11.0% |
| Standard Deviation (Population) | 8.7% | 10.8% |
Demographics Similar to Cubans and Houma by Seniors Poverty Over the Age of 75
In terms of seniors poverty over the age of 75, the demographic groups most similar to Cubans are Immigrants from Grenada (17.8%, a difference of 0.59%), Immigrants from Caribbean (18.2%, a difference of 1.6%), Immigrants from Nicaragua (17.6%, a difference of 2.1%), Immigrants from St. Vincent and the Grenadines (17.5%, a difference of 2.6%), and Immigrants from Armenia (17.5%, a difference of 2.8%). Similarly, the demographic groups most similar to Houma are Haitian (16.2%, a difference of 0.040%), Immigrants from Guyana (16.2%, a difference of 0.13%), Immigrants from Ecuador (16.1%, a difference of 0.74%), Immigrants from Yemen (16.5%, a difference of 1.5%), and Immigrants from Haiti (16.5%, a difference of 1.7%).
| Demographics | Rating | Rank | Seniors Poverty Over the Age of 75 |
| Immigrants | Ecuador | 0.0 /100 | #316 | Tragic 16.1% |
| Immigrants | Guyana | 0.0 /100 | #317 | Tragic 16.2% |
| Houma | 0.0 /100 | #318 | Tragic 16.2% |
| Haitians | 0.0 /100 | #319 | Tragic 16.2% |
| Immigrants | Yemen | 0.0 /100 | #320 | Tragic 16.5% |
| Immigrants | Haiti | 0.0 /100 | #321 | Tragic 16.5% |
| Immigrants | Barbados | 0.0 /100 | #322 | Tragic 16.5% |
| Central American Indians | 0.0 /100 | #323 | Tragic 16.5% |
| Immigrants | Uzbekistan | 0.0 /100 | #324 | Tragic 16.5% |
| Nicaraguans | 0.0 /100 | #325 | Tragic 16.6% |
| Pueblo | 0.0 /100 | #326 | Tragic 16.7% |
| Sioux | 0.0 /100 | #327 | Tragic 16.8% |
| Cape Verdeans | 0.0 /100 | #328 | Tragic 16.8% |
| Immigrants | Dominica | 0.0 /100 | #329 | Tragic 17.0% |
| British West Indians | 0.0 /100 | #330 | Tragic 17.4% |
| Immigrants | Armenia | 0.0 /100 | #331 | Tragic 17.5% |
| Immigrants | St. Vincent and the Grenadines | 0.0 /100 | #332 | Tragic 17.5% |
| Immigrants | Nicaragua | 0.0 /100 | #333 | Tragic 17.6% |
| Immigrants | Grenada | 0.0 /100 | #334 | Tragic 17.8% |
| Cubans | 0.0 /100 | #335 | Tragic 18.0% |
| Immigrants | Caribbean | 0.0 /100 | #336 | Tragic 18.2% |