Choctaw vs Immigrants from Afghanistan In Labor Force | Age 20-64
COMPARE
Choctaw
Immigrants from Afghanistan
In Labor Force | Age 20-64
In Labor Force | Age 20-64 Comparison
Choctaw
Immigrants from Afghanistan
75.4%
IN LABOR FORCE | AGE 20-64
0.0/ 100
METRIC RATING
324th/ 347
METRIC RANK
80.2%
IN LABOR FORCE | AGE 20-64
97.9/ 100
METRIC RATING
75th/ 347
METRIC RANK
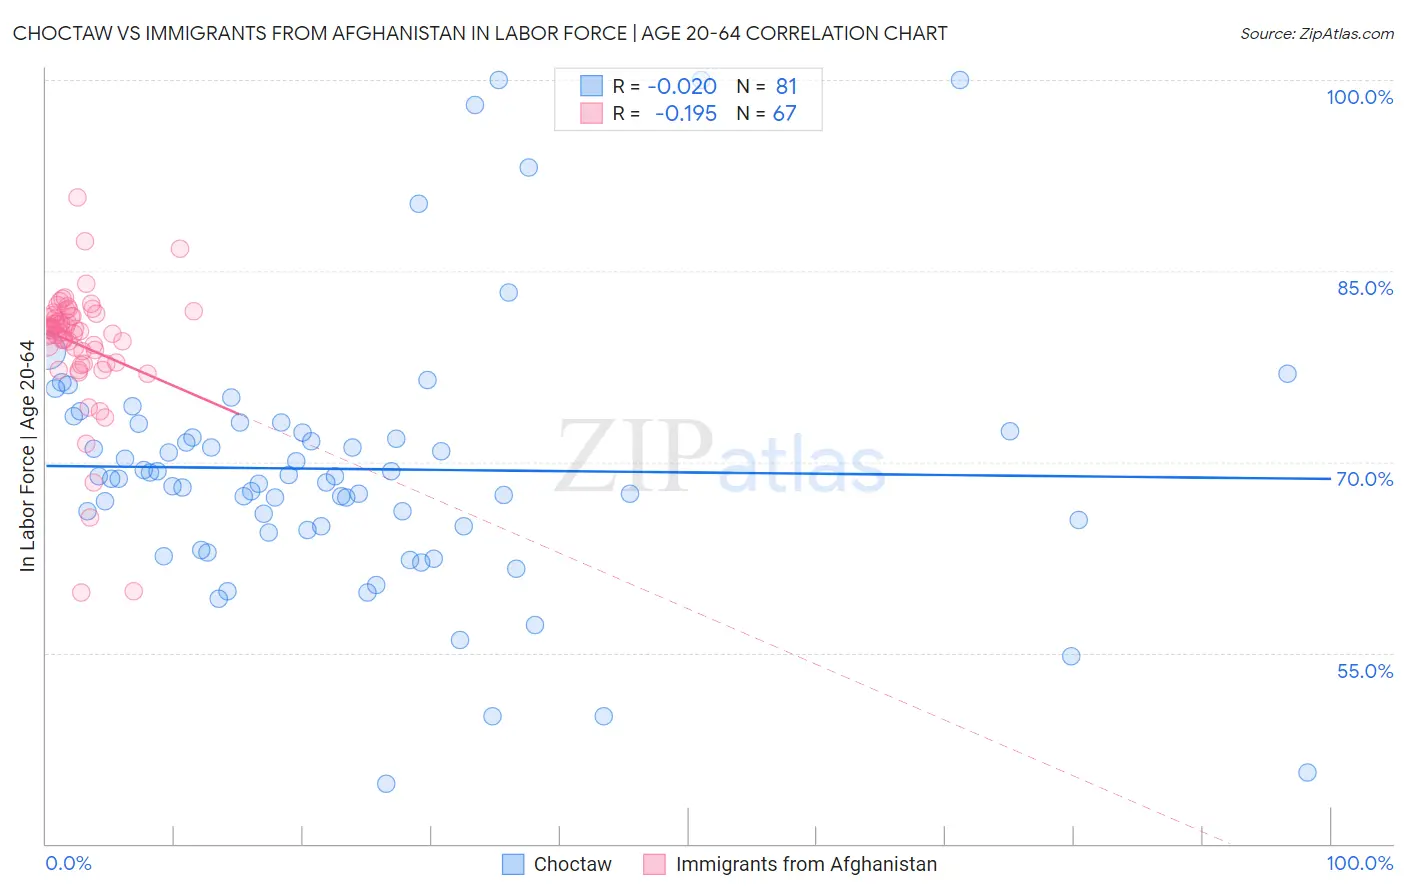
Choctaw vs Immigrants from Afghanistan In Labor Force | Age 20-64 Correlation Chart
The statistical analysis conducted on geographies consisting of 269,719,618 people shows no correlation between the proportion of Choctaw and labor force participation rate among population between the ages 20 and 64 in the United States with a correlation coefficient (R) of -0.020 and weighted average of 75.4%. Similarly, the statistical analysis conducted on geographies consisting of 147,645,979 people shows a poor negative correlation between the proportion of Immigrants from Afghanistan and labor force participation rate among population between the ages 20 and 64 in the United States with a correlation coefficient (R) of -0.195 and weighted average of 80.2%, a difference of 6.3%.
In Labor Force | Age 20-64 Correlation Summary
| Measurement | Choctaw | Immigrants from Afghanistan |
| Minimum | 44.7% | 59.7% |
| Maximum | 100.0% | 90.8% |
| Range | 55.3% | 31.1% |
| Mean | 69.4% | 79.2% |
| Median | 68.7% | 80.3% |
| Interquartile 25% (IQ1) | 64.8% | 77.8% |
| Interquartile 75% (IQ3) | 72.7% | 81.5% |
| Interquartile Range (IQR) | 7.9% | 3.7% |
| Standard Deviation (Sample) | 10.4% | 5.0% |
| Standard Deviation (Population) | 10.4% | 5.0% |
Similar Demographics by In Labor Force | Age 20-64
Demographics Similar to Choctaw by In Labor Force | Age 20-64
In terms of in labor force | age 20-64, the demographic groups most similar to Choctaw are Cajun (75.5%, a difference of 0.060%), Dutch West Indian (75.5%, a difference of 0.10%), Seminole (75.5%, a difference of 0.14%), Menominee (75.3%, a difference of 0.14%), and Creek (75.1%, a difference of 0.36%).
| Demographics | Rating | Rank | In Labor Force | Age 20-64 |
| Cherokee | 0.0 /100 | #317 | Tragic 76.2% |
| Chickasaw | 0.0 /100 | #318 | Tragic 76.2% |
| Inupiat | 0.0 /100 | #319 | Tragic 76.1% |
| Yakama | 0.0 /100 | #320 | Tragic 75.8% |
| Seminole | 0.0 /100 | #321 | Tragic 75.5% |
| Dutch West Indians | 0.0 /100 | #322 | Tragic 75.5% |
| Cajuns | 0.0 /100 | #323 | Tragic 75.5% |
| Choctaw | 0.0 /100 | #324 | Tragic 75.4% |
| Menominee | 0.0 /100 | #325 | Tragic 75.3% |
| Creek | 0.0 /100 | #326 | Tragic 75.1% |
| Sioux | 0.0 /100 | #327 | Tragic 75.0% |
| Kiowa | 0.0 /100 | #328 | Tragic 75.0% |
| Cheyenne | 0.0 /100 | #329 | Tragic 74.8% |
| Colville | 0.0 /100 | #330 | Tragic 74.8% |
| Paiute | 0.0 /100 | #331 | Tragic 74.7% |
Demographics Similar to Immigrants from Afghanistan by In Labor Force | Age 20-64
In terms of in labor force | age 20-64, the demographic groups most similar to Immigrants from Afghanistan are Immigrants from Eastern Europe (80.2%, a difference of 0.010%), Egyptian (80.2%, a difference of 0.010%), Immigrants from Colombia (80.2%, a difference of 0.010%), Immigrants from Romania (80.2%, a difference of 0.010%), and Cypriot (80.2%, a difference of 0.020%).
| Demographics | Rating | Rank | In Labor Force | Age 20-64 |
| Bhutanese | 98.6 /100 | #68 | Exceptional 80.2% |
| Albanians | 98.6 /100 | #69 | Exceptional 80.2% |
| Immigrants | Turkey | 98.5 /100 | #70 | Exceptional 80.2% |
| Soviet Union | 98.5 /100 | #71 | Exceptional 80.2% |
| Eastern Europeans | 98.4 /100 | #72 | Exceptional 80.2% |
| Cypriots | 98.2 /100 | #73 | Exceptional 80.2% |
| Immigrants | Eastern Europe | 98.1 /100 | #74 | Exceptional 80.2% |
| Immigrants | Afghanistan | 97.9 /100 | #75 | Exceptional 80.2% |
| Egyptians | 97.8 /100 | #76 | Exceptional 80.2% |
| Immigrants | Colombia | 97.8 /100 | #77 | Exceptional 80.2% |
| Immigrants | Romania | 97.8 /100 | #78 | Exceptional 80.2% |
| Asians | 97.7 /100 | #79 | Exceptional 80.2% |
| Immigrants | Croatia | 97.6 /100 | #80 | Exceptional 80.1% |
| German Russians | 97.3 /100 | #81 | Exceptional 80.1% |
| Immigrants | Japan | 97.3 /100 | #82 | Exceptional 80.1% |