Choctaw vs Immigrants from Afghanistan Cognitive Disability
COMPARE
Choctaw
Immigrants from Afghanistan
Cognitive Disability
Cognitive Disability Comparison
Choctaw
Immigrants from Afghanistan
18.4%
COGNITIVE DISABILITY
0.0/ 100
METRIC RATING
310th/ 347
METRIC RANK
17.5%
COGNITIVE DISABILITY
16.7/ 100
METRIC RATING
197th/ 347
METRIC RANK
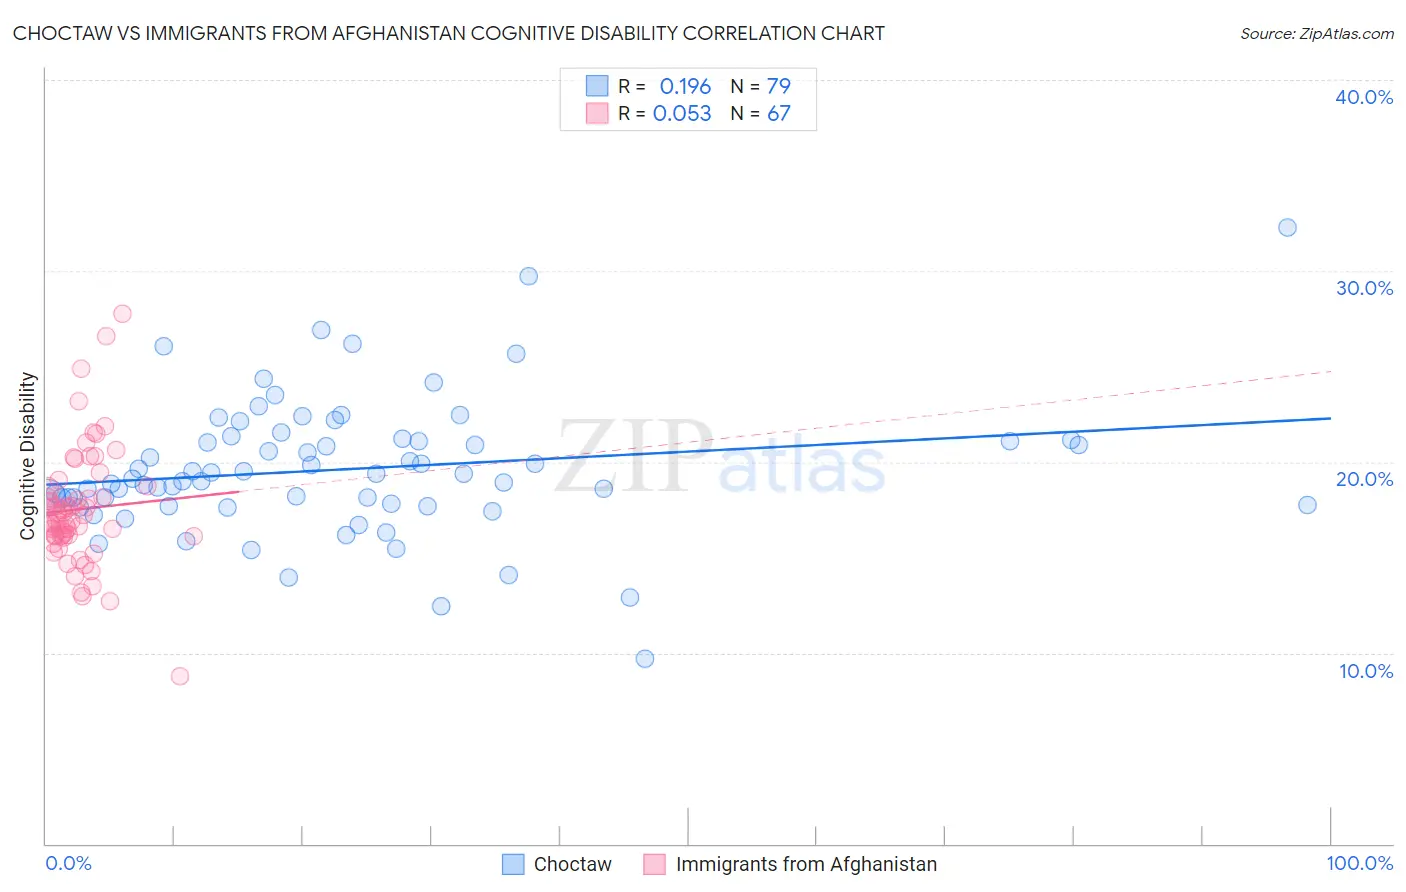
Choctaw vs Immigrants from Afghanistan Cognitive Disability Correlation Chart
The statistical analysis conducted on geographies consisting of 269,665,834 people shows a poor positive correlation between the proportion of Choctaw and percentage of population with cognitive disability in the United States with a correlation coefficient (R) of 0.196 and weighted average of 18.4%. Similarly, the statistical analysis conducted on geographies consisting of 147,641,735 people shows a slight positive correlation between the proportion of Immigrants from Afghanistan and percentage of population with cognitive disability in the United States with a correlation coefficient (R) of 0.053 and weighted average of 17.5%, a difference of 5.5%.
Cognitive Disability Correlation Summary
| Measurement | Choctaw | Immigrants from Afghanistan |
| Minimum | 9.7% | 8.8% |
| Maximum | 32.3% | 27.8% |
| Range | 22.6% | 19.0% |
| Mean | 19.6% | 17.5% |
| Median | 19.1% | 16.9% |
| Interquartile 25% (IQ1) | 17.8% | 16.1% |
| Interquartile 75% (IQ3) | 21.1% | 18.6% |
| Interquartile Range (IQR) | 3.4% | 2.5% |
| Standard Deviation (Sample) | 3.6% | 3.1% |
| Standard Deviation (Population) | 3.5% | 3.1% |
Similar Demographics by Cognitive Disability
Demographics Similar to Choctaw by Cognitive Disability
In terms of cognitive disability, the demographic groups most similar to Choctaw are Hmong (18.4%, a difference of 0.030%), Chickasaw (18.5%, a difference of 0.31%), Immigrants from Eastern Africa (18.4%, a difference of 0.37%), Immigrants from Western Africa (18.4%, a difference of 0.41%), and Yaqui (18.5%, a difference of 0.42%).
| Demographics | Rating | Rank | Cognitive Disability |
| Immigrants | Kenya | 0.0 /100 | #303 | Tragic 18.3% |
| Immigrants | Eritrea | 0.0 /100 | #304 | Tragic 18.3% |
| Colville | 0.0 /100 | #305 | Tragic 18.3% |
| Seminole | 0.0 /100 | #306 | Tragic 18.3% |
| Ugandans | 0.0 /100 | #307 | Tragic 18.3% |
| Immigrants | Western Africa | 0.0 /100 | #308 | Tragic 18.4% |
| Immigrants | Eastern Africa | 0.0 /100 | #309 | Tragic 18.4% |
| Choctaw | 0.0 /100 | #310 | Tragic 18.4% |
| Hmong | 0.0 /100 | #311 | Tragic 18.4% |
| Chickasaw | 0.0 /100 | #312 | Tragic 18.5% |
| Yaqui | 0.0 /100 | #313 | Tragic 18.5% |
| Sub-Saharan Africans | 0.0 /100 | #314 | Tragic 18.5% |
| Immigrants | Dominica | 0.0 /100 | #315 | Tragic 18.6% |
| Immigrants | Middle Africa | 0.0 /100 | #316 | Tragic 18.6% |
| Liberians | 0.0 /100 | #317 | Tragic 18.6% |
Demographics Similar to Immigrants from Afghanistan by Cognitive Disability
In terms of cognitive disability, the demographic groups most similar to Immigrants from Afghanistan are Guyanese (17.5%, a difference of 0.040%), Immigrants from Panama (17.5%, a difference of 0.10%), Immigrants from Singapore (17.5%, a difference of 0.13%), Haitian (17.5%, a difference of 0.14%), and New Zealander (17.4%, a difference of 0.20%).
| Demographics | Rating | Rank | Cognitive Disability |
| Immigrants | Spain | 27.7 /100 | #190 | Fair 17.4% |
| Immigrants | Nonimmigrants | 27.4 /100 | #191 | Fair 17.4% |
| Immigrants | Haiti | 27.1 /100 | #192 | Fair 17.4% |
| Delaware | 25.6 /100 | #193 | Fair 17.4% |
| Immigrants | Bosnia and Herzegovina | 22.0 /100 | #194 | Fair 17.4% |
| New Zealanders | 21.1 /100 | #195 | Fair 17.4% |
| Guyanese | 17.5 /100 | #196 | Poor 17.5% |
| Immigrants | Afghanistan | 16.7 /100 | #197 | Poor 17.5% |
| Immigrants | Panama | 14.8 /100 | #198 | Poor 17.5% |
| Immigrants | Singapore | 14.3 /100 | #199 | Poor 17.5% |
| Haitians | 14.1 /100 | #200 | Poor 17.5% |
| South American Indians | 13.0 /100 | #201 | Poor 17.5% |
| Immigrants | Morocco | 12.0 /100 | #202 | Poor 17.5% |
| Immigrants | Caribbean | 11.0 /100 | #203 | Poor 17.5% |
| Immigrants | Zimbabwe | 11.0 /100 | #204 | Poor 17.5% |