Cherokee vs Immigrants from Colombia 2 or more Vehicles in Household
COMPARE
Cherokee
Immigrants from Colombia
2 or more Vehicles in Household
2 or more Vehicles in Household Comparison
Cherokee
Immigrants from Colombia
59.9%
2 OR MORE VEHICLES IN HOUSEHOLD
100.0/ 100
METRIC RATING
40th/ 347
METRIC RANK
52.0%
2 OR MORE VEHICLES IN HOUSEHOLD
0.2/ 100
METRIC RATING
267th/ 347
METRIC RANK
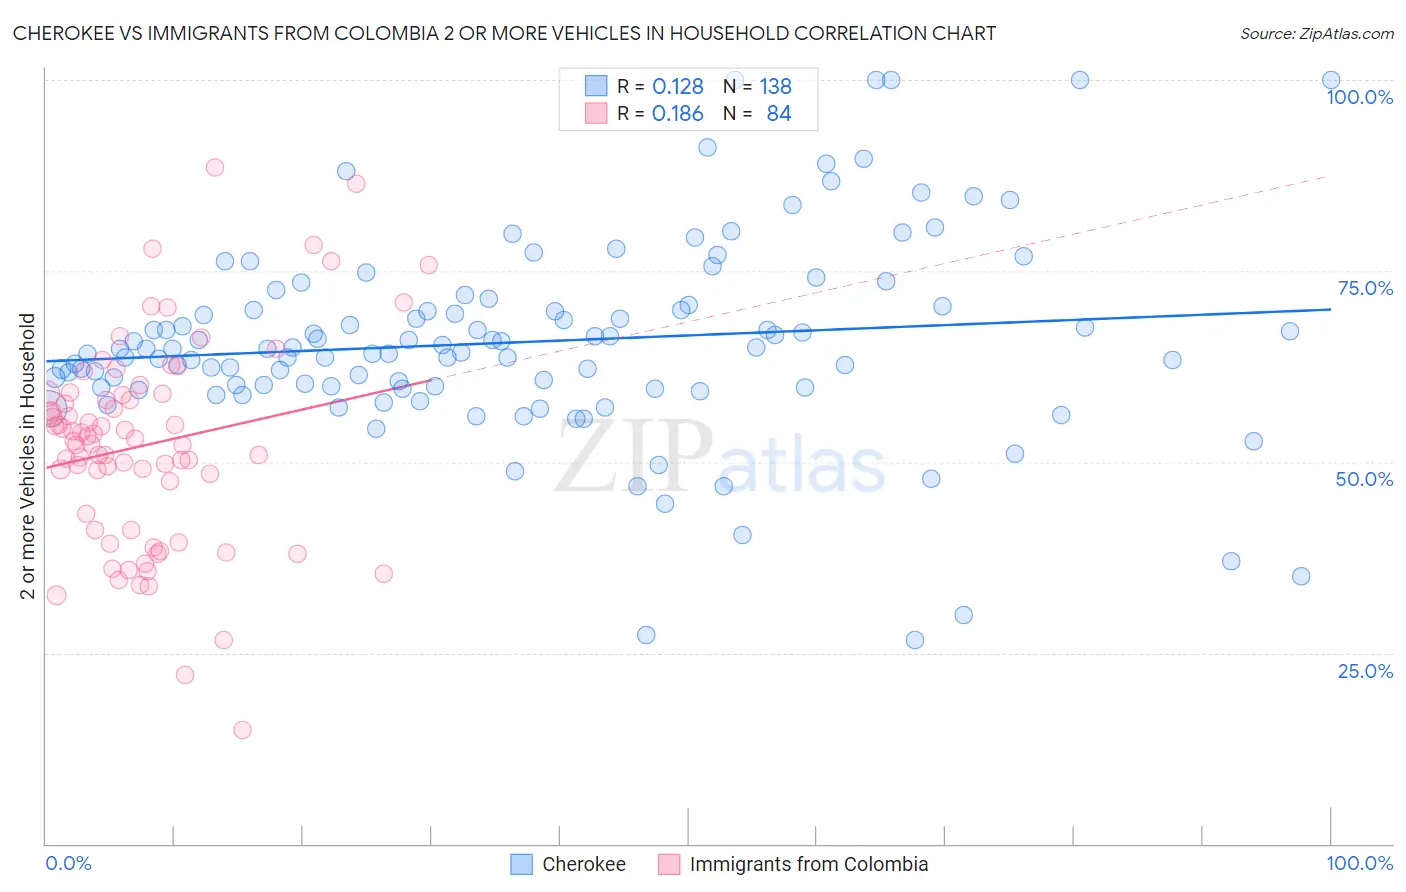
Cherokee vs Immigrants from Colombia 2 or more Vehicles in Household Correlation Chart
The statistical analysis conducted on geographies consisting of 493,419,390 people shows a poor positive correlation between the proportion of Cherokee and percentage of households with 2 or more vehicles available in the United States with a correlation coefficient (R) of 0.128 and weighted average of 59.9%. Similarly, the statistical analysis conducted on geographies consisting of 378,550,155 people shows a poor positive correlation between the proportion of Immigrants from Colombia and percentage of households with 2 or more vehicles available in the United States with a correlation coefficient (R) of 0.186 and weighted average of 52.0%, a difference of 15.1%.
2 or more Vehicles in Household Correlation Summary
| Measurement | Cherokee | Immigrants from Colombia |
| Minimum | 26.7% | 14.8% |
| Maximum | 100.0% | 88.6% |
| Range | 73.3% | 73.8% |
| Mean | 65.7% | 52.2% |
| Median | 64.8% | 52.9% |
| Interquartile 25% (IQ1) | 59.8% | 42.2% |
| Interquartile 75% (IQ3) | 70.3% | 58.8% |
| Interquartile Range (IQR) | 10.6% | 16.7% |
| Standard Deviation (Sample) | 13.1% | 13.4% |
| Standard Deviation (Population) | 13.0% | 13.3% |
Similar Demographics by 2 or more Vehicles in Household
Demographics Similar to Cherokee by 2 or more Vehicles in Household
In terms of 2 or more vehicles in household, the demographic groups most similar to Cherokee are Northern European (59.9%, a difference of 0.020%), Malaysian (59.8%, a difference of 0.030%), Czechoslovakian (59.8%, a difference of 0.11%), French (59.8%, a difference of 0.17%), and Immigrants from Taiwan (59.7%, a difference of 0.21%).
| Demographics | Rating | Rank | 2 or more Vehicles in Household |
| Immigrants | Mexico | 100.0 /100 | #33 | Exceptional 60.2% |
| Spanish | 100.0 /100 | #34 | Exceptional 60.2% |
| Immigrants | Philippines | 100.0 /100 | #35 | Exceptional 60.1% |
| Chinese | 100.0 /100 | #36 | Exceptional 60.1% |
| Irish | 100.0 /100 | #37 | Exceptional 60.1% |
| Americans | 100.0 /100 | #38 | Exceptional 60.0% |
| British | 100.0 /100 | #39 | Exceptional 60.0% |
| Cherokee | 100.0 /100 | #40 | Exceptional 59.9% |
| Northern Europeans | 100.0 /100 | #41 | Exceptional 59.9% |
| Malaysians | 100.0 /100 | #42 | Exceptional 59.8% |
| Czechoslovakians | 100.0 /100 | #43 | Exceptional 59.8% |
| French | 100.0 /100 | #44 | Exceptional 59.8% |
| Immigrants | Taiwan | 100.0 /100 | #45 | Exceptional 59.7% |
| Immigrants | South Eastern Asia | 100.0 /100 | #46 | Exceptional 59.6% |
| Yaqui | 99.9 /100 | #47 | Exceptional 59.3% |
Demographics Similar to Immigrants from Colombia by 2 or more Vehicles in Household
In terms of 2 or more vehicles in household, the demographic groups most similar to Immigrants from Colombia are Pima (52.0%, a difference of 0.010%), Honduran (52.0%, a difference of 0.010%), Immigrants from Ireland (52.0%, a difference of 0.040%), Immigrants from France (52.0%, a difference of 0.050%), and Immigrants from Congo (52.1%, a difference of 0.19%).
| Demographics | Rating | Rank | 2 or more Vehicles in Household |
| Immigrants | Bahamas | 0.5 /100 | #260 | Tragic 52.5% |
| Immigrants | Australia | 0.5 /100 | #261 | Tragic 52.4% |
| Immigrants | Northern Africa | 0.4 /100 | #262 | Tragic 52.3% |
| Immigrants | Southern Europe | 0.4 /100 | #263 | Tragic 52.3% |
| Immigrants | Latvia | 0.4 /100 | #264 | Tragic 52.2% |
| Immigrants | Congo | 0.3 /100 | #265 | Tragic 52.1% |
| Immigrants | France | 0.2 /100 | #266 | Tragic 52.0% |
| Immigrants | Colombia | 0.2 /100 | #267 | Tragic 52.0% |
| Pima | 0.2 /100 | #268 | Tragic 52.0% |
| Hondurans | 0.2 /100 | #269 | Tragic 52.0% |
| Immigrants | Ireland | 0.2 /100 | #270 | Tragic 52.0% |
| South Americans | 0.2 /100 | #271 | Tragic 51.9% |
| Sub-Saharan Africans | 0.2 /100 | #272 | Tragic 51.9% |
| Israelis | 0.2 /100 | #273 | Tragic 51.9% |
| Africans | 0.2 /100 | #274 | Tragic 51.8% |