Immigrants from Eastern Asia vs Immigrants from Colombia 2 or more Vehicles in Household
COMPARE
Immigrants from Eastern Asia
Immigrants from Colombia
2 or more Vehicles in Household
2 or more Vehicles in Household Comparison
Immigrants from Eastern Asia
Immigrants from Colombia
53.2%
2 OR MORE VEHICLES IN HOUSEHOLD
2.1/ 100
METRIC RATING
242nd/ 347
METRIC RANK
52.0%
2 OR MORE VEHICLES IN HOUSEHOLD
0.2/ 100
METRIC RATING
267th/ 347
METRIC RANK
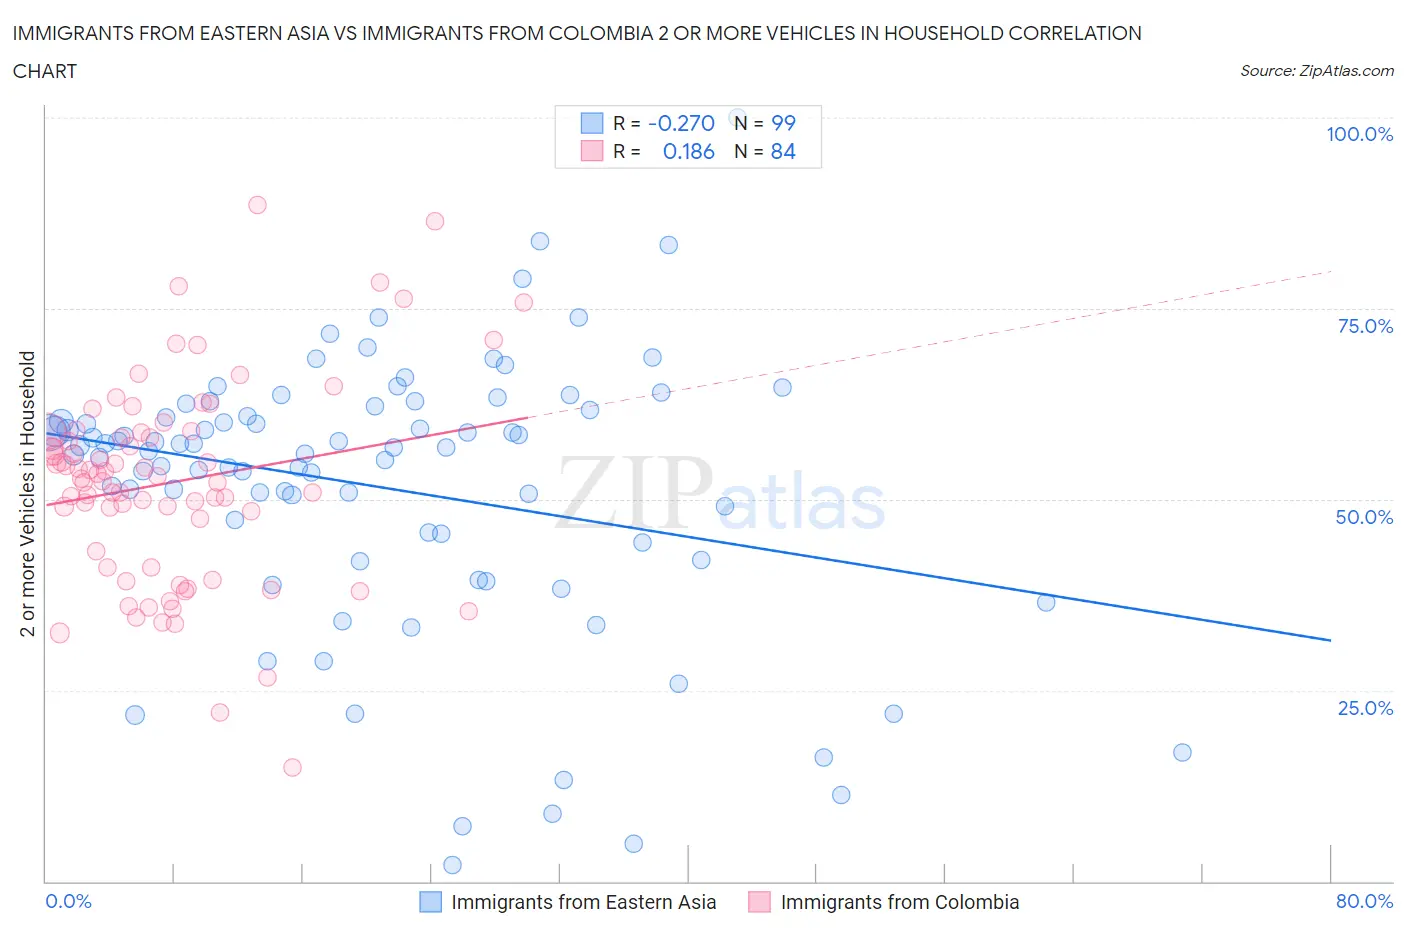
Immigrants from Eastern Asia vs Immigrants from Colombia 2 or more Vehicles in Household Correlation Chart
The statistical analysis conducted on geographies consisting of 499,455,795 people shows a weak negative correlation between the proportion of Immigrants from Eastern Asia and percentage of households with 2 or more vehicles available in the United States with a correlation coefficient (R) of -0.270 and weighted average of 53.2%. Similarly, the statistical analysis conducted on geographies consisting of 378,550,155 people shows a poor positive correlation between the proportion of Immigrants from Colombia and percentage of households with 2 or more vehicles available in the United States with a correlation coefficient (R) of 0.186 and weighted average of 52.0%, a difference of 2.3%.
2 or more Vehicles in Household Correlation Summary
| Measurement | Immigrants from Eastern Asia | Immigrants from Colombia |
| Minimum | 2.1% | 14.8% |
| Maximum | 100.0% | 88.6% |
| Range | 97.9% | 73.8% |
| Mean | 51.5% | 52.2% |
| Median | 56.8% | 52.9% |
| Interquartile 25% (IQ1) | 44.3% | 42.2% |
| Interquartile 75% (IQ3) | 61.7% | 58.8% |
| Interquartile Range (IQR) | 17.4% | 16.7% |
| Standard Deviation (Sample) | 18.0% | 13.4% |
| Standard Deviation (Population) | 17.9% | 13.3% |
Similar Demographics by 2 or more Vehicles in Household
Demographics Similar to Immigrants from Eastern Asia by 2 or more Vehicles in Household
In terms of 2 or more vehicles in household, the demographic groups most similar to Immigrants from Eastern Asia are Immigrants from Sierra Leone (53.2%, a difference of 0.0%), Immigrants from Europe (53.2%, a difference of 0.030%), Cambodian (53.3%, a difference of 0.10%), Immigrants from Armenia (53.3%, a difference of 0.11%), and Macedonian (53.3%, a difference of 0.17%).
| Demographics | Rating | Rank | 2 or more Vehicles in Household |
| Immigrants | Middle Africa | 3.0 /100 | #235 | Tragic 53.4% |
| Indonesians | 2.7 /100 | #236 | Tragic 53.4% |
| Macedonians | 2.4 /100 | #237 | Tragic 53.3% |
| Immigrants | Armenia | 2.3 /100 | #238 | Tragic 53.3% |
| Cambodians | 2.3 /100 | #239 | Tragic 53.3% |
| Immigrants | Europe | 2.1 /100 | #240 | Tragic 53.2% |
| Immigrants | Sierra Leone | 2.1 /100 | #241 | Tragic 53.2% |
| Immigrants | Eastern Asia | 2.1 /100 | #242 | Tragic 53.2% |
| Ethiopians | 1.7 /100 | #243 | Tragic 53.1% |
| Indians (Asian) | 1.7 /100 | #244 | Tragic 53.1% |
| Immigrants | Ethiopia | 1.5 /100 | #245 | Tragic 53.0% |
| Immigrants | Nigeria | 1.2 /100 | #246 | Tragic 52.9% |
| Sierra Leoneans | 1.2 /100 | #247 | Tragic 52.9% |
| Colombians | 1.1 /100 | #248 | Tragic 52.9% |
| Immigrants | Brazil | 1.0 /100 | #249 | Tragic 52.8% |
Demographics Similar to Immigrants from Colombia by 2 or more Vehicles in Household
In terms of 2 or more vehicles in household, the demographic groups most similar to Immigrants from Colombia are Pima (52.0%, a difference of 0.010%), Honduran (52.0%, a difference of 0.010%), Immigrants from Ireland (52.0%, a difference of 0.040%), Immigrants from France (52.0%, a difference of 0.050%), and Immigrants from Congo (52.1%, a difference of 0.19%).
| Demographics | Rating | Rank | 2 or more Vehicles in Household |
| Immigrants | Bahamas | 0.5 /100 | #260 | Tragic 52.5% |
| Immigrants | Australia | 0.5 /100 | #261 | Tragic 52.4% |
| Immigrants | Northern Africa | 0.4 /100 | #262 | Tragic 52.3% |
| Immigrants | Southern Europe | 0.4 /100 | #263 | Tragic 52.3% |
| Immigrants | Latvia | 0.4 /100 | #264 | Tragic 52.2% |
| Immigrants | Congo | 0.3 /100 | #265 | Tragic 52.1% |
| Immigrants | France | 0.2 /100 | #266 | Tragic 52.0% |
| Immigrants | Colombia | 0.2 /100 | #267 | Tragic 52.0% |
| Pima | 0.2 /100 | #268 | Tragic 52.0% |
| Hondurans | 0.2 /100 | #269 | Tragic 52.0% |
| Immigrants | Ireland | 0.2 /100 | #270 | Tragic 52.0% |
| South Americans | 0.2 /100 | #271 | Tragic 51.9% |
| Sub-Saharan Africans | 0.2 /100 | #272 | Tragic 51.9% |
| Israelis | 0.2 /100 | #273 | Tragic 51.9% |
| Africans | 0.2 /100 | #274 | Tragic 51.8% |