Cherokee vs Immigrants from Colombia Unemployment Among Ages 30 to 34 years
COMPARE
Cherokee
Immigrants from Colombia
Unemployment Among Ages 30 to 34 years
Unemployment Among Ages 30 to 34 years Comparison
Cherokee
Immigrants from Colombia
6.4%
UNEMPLOYMENT AMONG AGES 30 TO 34 YEARS
0.0/ 100
METRIC RATING
280th/ 347
METRIC RANK
5.4%
UNEMPLOYMENT AMONG AGES 30 TO 34 YEARS
68.9/ 100
METRIC RATING
149th/ 347
METRIC RANK
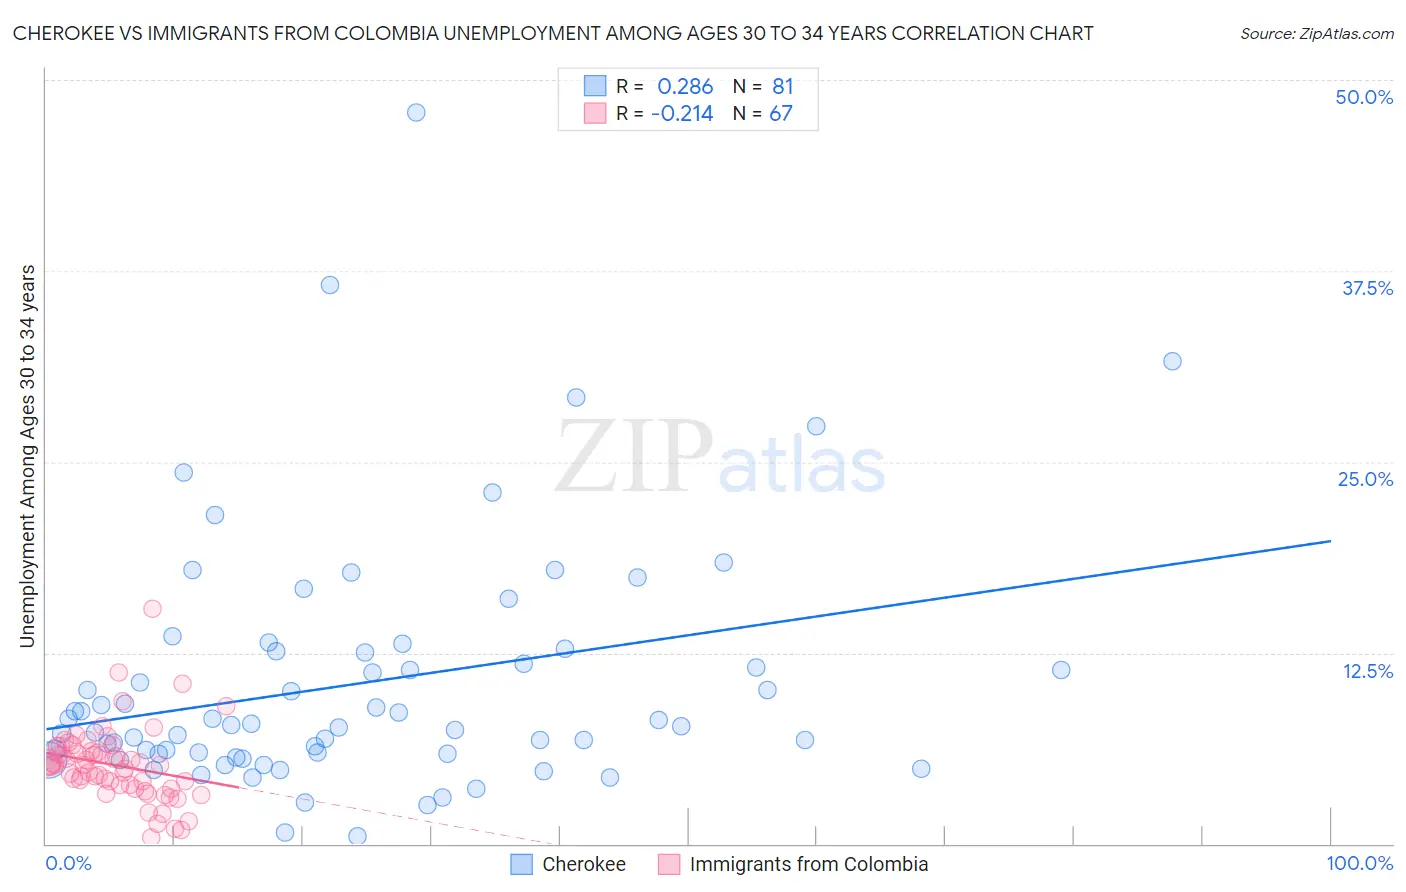
Cherokee vs Immigrants from Colombia Unemployment Among Ages 30 to 34 years Correlation Chart
The statistical analysis conducted on geographies consisting of 448,717,195 people shows a weak positive correlation between the proportion of Cherokee and unemployment rate among population between the ages 30 and 34 in the United States with a correlation coefficient (R) of 0.286 and weighted average of 6.4%. Similarly, the statistical analysis conducted on geographies consisting of 359,255,220 people shows a weak negative correlation between the proportion of Immigrants from Colombia and unemployment rate among population between the ages 30 and 34 in the United States with a correlation coefficient (R) of -0.214 and weighted average of 5.4%, a difference of 18.3%.
Unemployment Among Ages 30 to 34 years Correlation Summary
| Measurement | Cherokee | Immigrants from Colombia |
| Minimum | 0.50% | 0.40% |
| Maximum | 47.8% | 15.4% |
| Range | 47.3% | 15.0% |
| Mean | 10.5% | 5.1% |
| Median | 7.8% | 5.2% |
| Interquartile 25% (IQ1) | 5.9% | 3.8% |
| Interquartile 75% (IQ3) | 12.5% | 6.0% |
| Interquartile Range (IQR) | 6.7% | 2.2% |
| Standard Deviation (Sample) | 8.1% | 2.4% |
| Standard Deviation (Population) | 8.0% | 2.4% |
Similar Demographics by Unemployment Among Ages 30 to 34 years
Demographics Similar to Cherokee by Unemployment Among Ages 30 to 34 years
In terms of unemployment among ages 30 to 34 years, the demographic groups most similar to Cherokee are Cree (6.4%, a difference of 0.040%), Immigrants from Caribbean (6.4%, a difference of 0.32%), Osage (6.3%, a difference of 0.52%), Immigrants from Ecuador (6.3%, a difference of 0.61%), and African (6.4%, a difference of 0.70%).
| Demographics | Rating | Rank | Unemployment Among Ages 30 to 34 years |
| Ottawa | 0.0 /100 | #273 | Tragic 6.3% |
| U.S. Virgin Islanders | 0.0 /100 | #274 | Tragic 6.3% |
| Ecuadorians | 0.0 /100 | #275 | Tragic 6.3% |
| Pennsylvania Germans | 0.0 /100 | #276 | Tragic 6.3% |
| Immigrants | Ecuador | 0.0 /100 | #277 | Tragic 6.3% |
| Osage | 0.0 /100 | #278 | Tragic 6.3% |
| Cree | 0.0 /100 | #279 | Tragic 6.4% |
| Cherokee | 0.0 /100 | #280 | Tragic 6.4% |
| Immigrants | Caribbean | 0.0 /100 | #281 | Tragic 6.4% |
| Africans | 0.0 /100 | #282 | Tragic 6.4% |
| Hispanics or Latinos | 0.0 /100 | #283 | Tragic 6.4% |
| Immigrants | Bangladesh | 0.0 /100 | #284 | Tragic 6.4% |
| Choctaw | 0.0 /100 | #285 | Tragic 6.4% |
| Central American Indians | 0.0 /100 | #286 | Tragic 6.4% |
| Immigrants | West Indies | 0.0 /100 | #287 | Tragic 6.4% |
Demographics Similar to Immigrants from Colombia by Unemployment Among Ages 30 to 34 years
In terms of unemployment among ages 30 to 34 years, the demographic groups most similar to Immigrants from Colombia are Colombian (5.4%, a difference of 0.010%), Immigrants from Iran (5.4%, a difference of 0.020%), Ukrainian (5.4%, a difference of 0.030%), Immigrants from Oceania (5.4%, a difference of 0.060%), and Celtic (5.4%, a difference of 0.11%).
| Demographics | Rating | Rank | Unemployment Among Ages 30 to 34 years |
| Immigrants | Greece | 72.0 /100 | #142 | Good 5.4% |
| Russians | 71.1 /100 | #143 | Good 5.4% |
| Immigrants | Russia | 71.0 /100 | #144 | Good 5.4% |
| Syrians | 70.3 /100 | #145 | Good 5.4% |
| Celtics | 70.2 /100 | #146 | Good 5.4% |
| Ukrainians | 69.2 /100 | #147 | Good 5.4% |
| Immigrants | Iran | 69.1 /100 | #148 | Good 5.4% |
| Immigrants | Colombia | 68.9 /100 | #149 | Good 5.4% |
| Colombians | 68.7 /100 | #150 | Good 5.4% |
| Immigrants | Oceania | 68.1 /100 | #151 | Good 5.4% |
| Lebanese | 67.2 /100 | #152 | Good 5.4% |
| Immigrants | South Eastern Asia | 66.5 /100 | #153 | Good 5.4% |
| South Africans | 66.5 /100 | #154 | Good 5.4% |
| Immigrants | Hungary | 66.1 /100 | #155 | Good 5.4% |
| Czechoslovakians | 63.7 /100 | #156 | Good 5.4% |