Cherokee vs Immigrants from Colombia Median Family Income
COMPARE
Cherokee
Immigrants from Colombia
Median Family Income
Median Family Income Comparison
Cherokee
Immigrants from Colombia
$88,209
MEDIAN FAMILY INCOME
0.1/ 100
METRIC RATING
288th/ 347
METRIC RANK
$98,067
MEDIAN FAMILY INCOME
8.7/ 100
METRIC RATING
209th/ 347
METRIC RANK
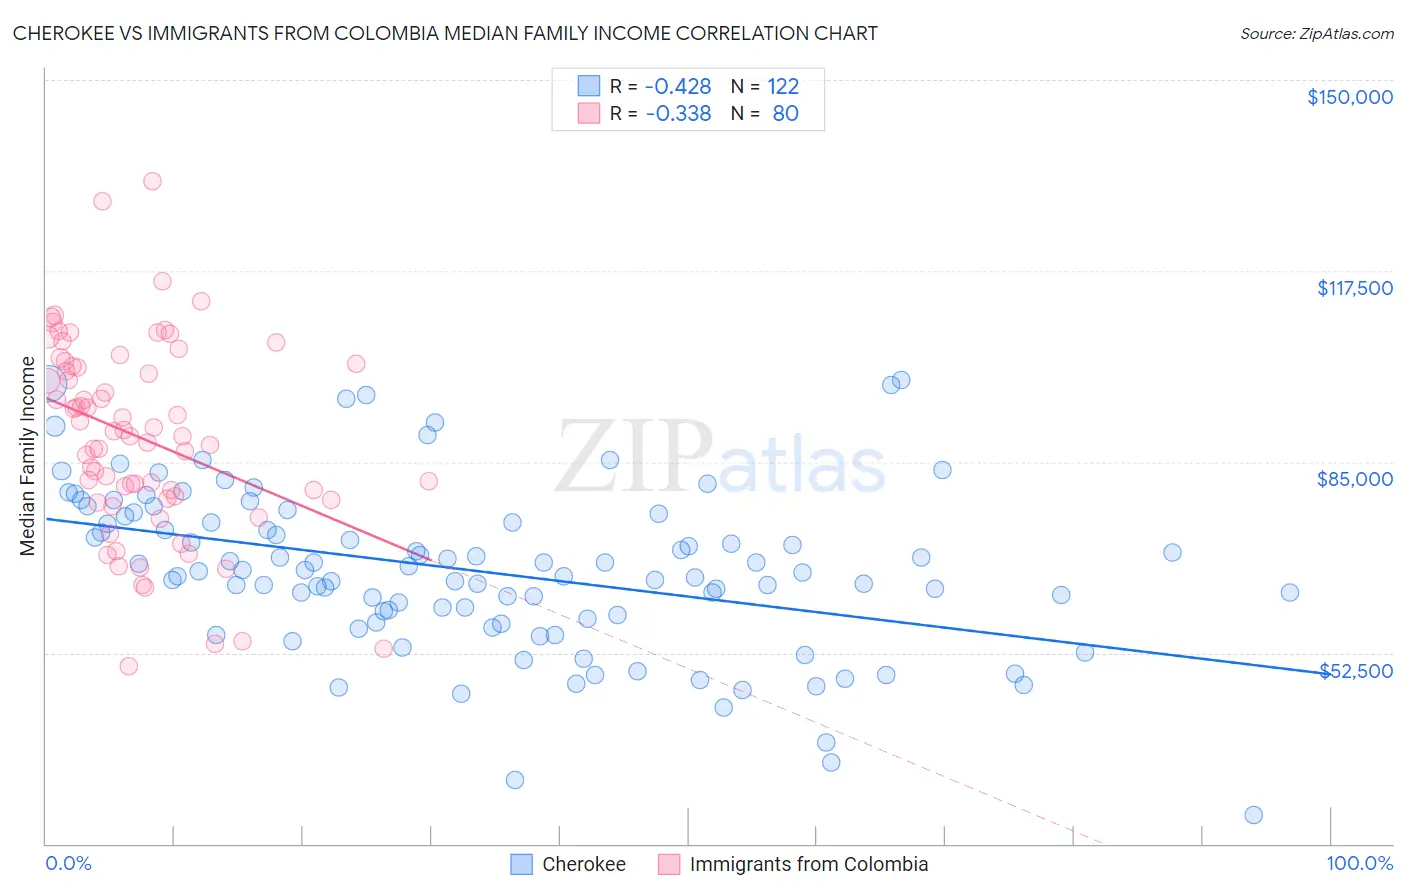
Cherokee vs Immigrants from Colombia Median Family Income Correlation Chart
The statistical analysis conducted on geographies consisting of 493,078,219 people shows a moderate negative correlation between the proportion of Cherokee and median family income in the United States with a correlation coefficient (R) of -0.428 and weighted average of $88,209. Similarly, the statistical analysis conducted on geographies consisting of 378,430,700 people shows a mild negative correlation between the proportion of Immigrants from Colombia and median family income in the United States with a correlation coefficient (R) of -0.338 and weighted average of $98,067, a difference of 11.2%.
Median Family Income Correlation Summary
| Measurement | Cherokee | Immigrants from Colombia |
| Minimum | $25,000 | $50,234 |
| Maximum | $98,929 | $132,768 |
| Range | $73,929 | $82,534 |
| Mean | $66,366 | $89,152 |
| Median | $66,333 | $89,834 |
| Interquartile 25% (IQ1) | $58,393 | $78,980 |
| Interquartile 75% (IQ3) | $74,712 | $101,483 |
| Interquartile Range (IQR) | $16,319 | $22,502 |
| Standard Deviation (Sample) | $13,972 | $16,604 |
| Standard Deviation (Population) | $13,915 | $16,499 |
Similar Demographics by Median Family Income
Demographics Similar to Cherokee by Median Family Income
In terms of median family income, the demographic groups most similar to Cherokee are Potawatomi ($88,265, a difference of 0.060%), Immigrants from Nicaragua ($88,267, a difference of 0.070%), Indonesian ($88,301, a difference of 0.10%), Guatemalan ($88,295, a difference of 0.10%), and Bangladeshi ($88,358, a difference of 0.17%).
| Demographics | Rating | Rank | Median Family Income |
| Blackfeet | 0.1 /100 | #281 | Tragic $88,717 |
| Comanche | 0.1 /100 | #282 | Tragic $88,556 |
| Bangladeshis | 0.1 /100 | #283 | Tragic $88,358 |
| Indonesians | 0.1 /100 | #284 | Tragic $88,301 |
| Guatemalans | 0.1 /100 | #285 | Tragic $88,295 |
| Immigrants | Nicaragua | 0.1 /100 | #286 | Tragic $88,267 |
| Potawatomi | 0.1 /100 | #287 | Tragic $88,265 |
| Cherokee | 0.1 /100 | #288 | Tragic $88,209 |
| Central American Indians | 0.1 /100 | #289 | Tragic $88,034 |
| Shoshone | 0.1 /100 | #290 | Tragic $87,872 |
| Immigrants | Cabo Verde | 0.1 /100 | #291 | Tragic $87,830 |
| Africans | 0.1 /100 | #292 | Tragic $87,820 |
| Ute | 0.0 /100 | #293 | Tragic $87,596 |
| Fijians | 0.0 /100 | #294 | Tragic $87,387 |
| Yaqui | 0.0 /100 | #295 | Tragic $87,289 |
Demographics Similar to Immigrants from Colombia by Median Family Income
In terms of median family income, the demographic groups most similar to Immigrants from Colombia are Puget Sound Salish ($97,958, a difference of 0.11%), Immigrants from Uruguay ($98,205, a difference of 0.14%), Immigrants from Sudan ($97,737, a difference of 0.34%), Panamanian ($97,683, a difference of 0.39%), and Immigrants from Armenia ($97,605, a difference of 0.47%).
| Demographics | Rating | Rank | Median Family Income |
| Whites/Caucasians | 18.7 /100 | #202 | Poor $99,800 |
| Scotch-Irish | 17.1 /100 | #203 | Poor $99,591 |
| Ghanaians | 12.6 /100 | #204 | Poor $98,877 |
| Hawaiians | 12.5 /100 | #205 | Poor $98,869 |
| Immigrants | Iraq | 12.1 /100 | #206 | Poor $98,786 |
| Aleuts | 11.6 /100 | #207 | Poor $98,702 |
| Immigrants | Uruguay | 9.2 /100 | #208 | Tragic $98,205 |
| Immigrants | Colombia | 8.7 /100 | #209 | Tragic $98,067 |
| Puget Sound Salish | 8.2 /100 | #210 | Tragic $97,958 |
| Immigrants | Sudan | 7.4 /100 | #211 | Tragic $97,737 |
| Panamanians | 7.2 /100 | #212 | Tragic $97,683 |
| Immigrants | Armenia | 7.0 /100 | #213 | Tragic $97,605 |
| Bermudans | 6.9 /100 | #214 | Tragic $97,577 |
| Nigerians | 6.7 /100 | #215 | Tragic $97,522 |
| Immigrants | Bosnia and Herzegovina | 6.4 /100 | #216 | Tragic $97,432 |