Cherokee vs Immigrants from Colombia Family Households
COMPARE
Cherokee
Immigrants from Colombia
Family Households
Family Households Comparison
Cherokee
Immigrants from Colombia
65.0%
FAMILY HOUSEHOLDS
95.3/ 100
METRIC RATING
117th/ 347
METRIC RANK
66.3%
FAMILY HOUSEHOLDS
100.0/ 100
METRIC RATING
54th/ 347
METRIC RANK
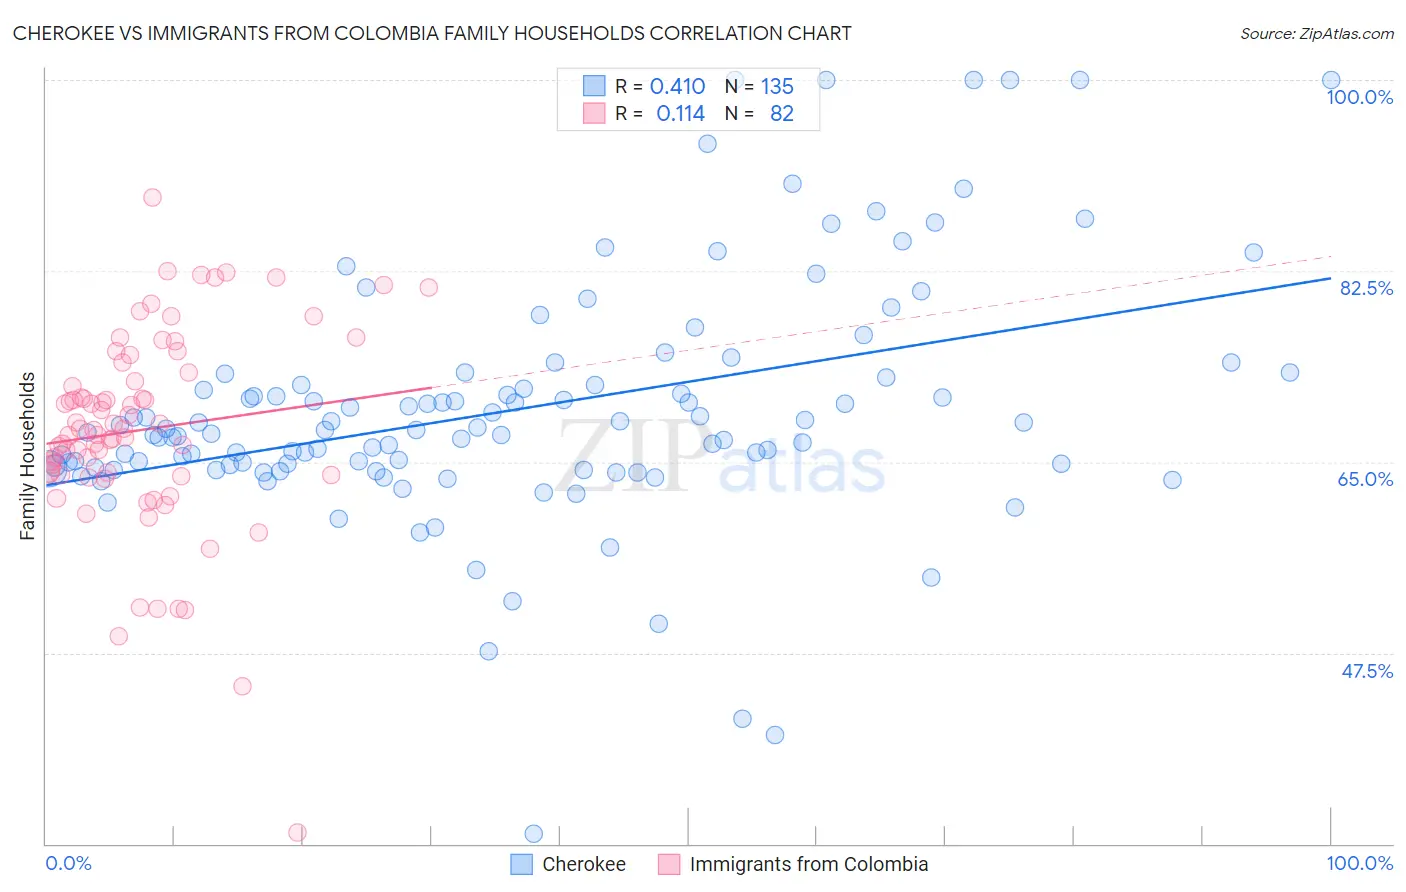
Cherokee vs Immigrants from Colombia Family Households Correlation Chart
The statistical analysis conducted on geographies consisting of 493,383,151 people shows a moderate positive correlation between the proportion of Cherokee and percentage of family households in the United States with a correlation coefficient (R) of 0.410 and weighted average of 65.0%. Similarly, the statistical analysis conducted on geographies consisting of 378,535,388 people shows a poor positive correlation between the proportion of Immigrants from Colombia and percentage of family households in the United States with a correlation coefficient (R) of 0.114 and weighted average of 66.3%, a difference of 2.0%.
Family Households Correlation Summary
| Measurement | Cherokee | Immigrants from Colombia |
| Minimum | 31.0% | 31.0% |
| Maximum | 100.0% | 89.3% |
| Range | 69.0% | 58.3% |
| Mean | 69.9% | 67.9% |
| Median | 67.9% | 68.0% |
| Interquartile 25% (IQ1) | 64.5% | 63.8% |
| Interquartile 75% (IQ3) | 72.7% | 73.2% |
| Interquartile Range (IQR) | 8.2% | 9.4% |
| Standard Deviation (Sample) | 11.2% | 9.3% |
| Standard Deviation (Population) | 11.2% | 9.2% |
Similar Demographics by Family Households
Demographics Similar to Cherokee by Family Households
In terms of family households, the demographic groups most similar to Cherokee are Immigrants from Iraq (65.0%, a difference of 0.0%), Ecuadorian (65.0%, a difference of 0.010%), Dutch (64.9%, a difference of 0.020%), Argentinean (65.0%, a difference of 0.030%), and Immigrants from Eastern Asia (64.9%, a difference of 0.060%).
| Demographics | Rating | Rank | Family Households |
| Scandinavians | 96.8 /100 | #110 | Exceptional 65.0% |
| Europeans | 96.8 /100 | #111 | Exceptional 65.0% |
| Immigrants | Jordan | 96.5 /100 | #112 | Exceptional 65.0% |
| Spanish | 96.2 /100 | #113 | Exceptional 65.0% |
| Argentineans | 95.7 /100 | #114 | Exceptional 65.0% |
| Ecuadorians | 95.4 /100 | #115 | Exceptional 65.0% |
| Immigrants | Iraq | 95.4 /100 | #116 | Exceptional 65.0% |
| Cherokee | 95.3 /100 | #117 | Exceptional 65.0% |
| Dutch | 95.1 /100 | #118 | Exceptional 64.9% |
| Immigrants | Eastern Asia | 94.4 /100 | #119 | Exceptional 64.9% |
| Immigrants | Oceania | 94.2 /100 | #120 | Exceptional 64.9% |
| Hungarians | 94.0 /100 | #121 | Exceptional 64.9% |
| Hmong | 93.4 /100 | #122 | Exceptional 64.9% |
| Choctaw | 93.4 /100 | #123 | Exceptional 64.9% |
| Immigrants | Argentina | 92.8 /100 | #124 | Exceptional 64.9% |
Demographics Similar to Immigrants from Colombia by Family Households
In terms of family households, the demographic groups most similar to Immigrants from Colombia are Afghan (66.3%, a difference of 0.0%), Colombian (66.3%, a difference of 0.010%), Native/Alaskan (66.4%, a difference of 0.14%), Navajo (66.4%, a difference of 0.17%), and Immigrants (66.1%, a difference of 0.17%).
| Demographics | Rating | Rank | Family Households |
| Bolivians | 100.0 /100 | #47 | Exceptional 66.5% |
| Immigrants | Venezuela | 100.0 /100 | #48 | Exceptional 66.4% |
| Immigrants | South Central Asia | 100.0 /100 | #49 | Exceptional 66.4% |
| Navajo | 100.0 /100 | #50 | Exceptional 66.4% |
| Natives/Alaskans | 100.0 /100 | #51 | Exceptional 66.4% |
| Colombians | 100.0 /100 | #52 | Exceptional 66.3% |
| Afghans | 100.0 /100 | #53 | Exceptional 66.3% |
| Immigrants | Colombia | 100.0 /100 | #54 | Exceptional 66.3% |
| Immigrants | Immigrants | 100.0 /100 | #55 | Exceptional 66.1% |
| Immigrants | Hong Kong | 100.0 /100 | #56 | Exceptional 66.1% |
| Pennsylvania Germans | 100.0 /100 | #57 | Exceptional 66.1% |
| Immigrants | Asia | 100.0 /100 | #58 | Exceptional 66.1% |
| Immigrants | Korea | 100.0 /100 | #59 | Exceptional 66.0% |
| South Americans | 100.0 /100 | #60 | Exceptional 66.0% |
| Danes | 100.0 /100 | #61 | Exceptional 66.0% |