Native/Alaskan vs Immigrants from Colombia 2 or more Vehicles in Household
COMPARE
Native/Alaskan
Immigrants from Colombia
2 or more Vehicles in Household
2 or more Vehicles in Household Comparison
Natives/Alaskans
Immigrants from Colombia
57.0%
2 OR MORE VEHICLES IN HOUSEHOLD
95.0/ 100
METRIC RATING
119th/ 347
METRIC RANK
52.0%
2 OR MORE VEHICLES IN HOUSEHOLD
0.2/ 100
METRIC RATING
267th/ 347
METRIC RANK
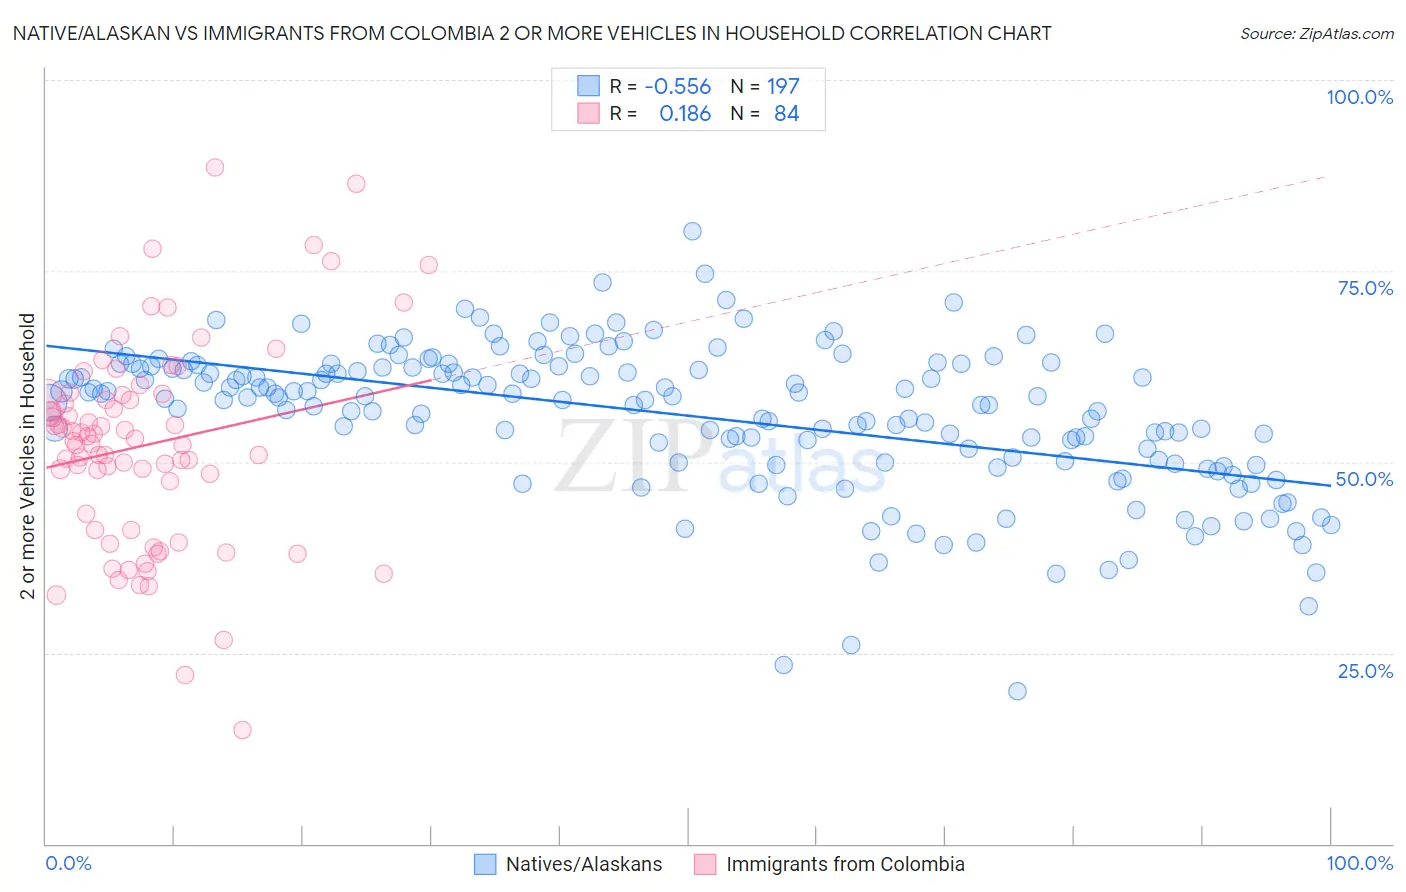
Native/Alaskan vs Immigrants from Colombia 2 or more Vehicles in Household Correlation Chart
The statistical analysis conducted on geographies consisting of 512,668,217 people shows a substantial negative correlation between the proportion of Natives/Alaskans and percentage of households with 2 or more vehicles available in the United States with a correlation coefficient (R) of -0.556 and weighted average of 57.0%. Similarly, the statistical analysis conducted on geographies consisting of 378,550,155 people shows a poor positive correlation between the proportion of Immigrants from Colombia and percentage of households with 2 or more vehicles available in the United States with a correlation coefficient (R) of 0.186 and weighted average of 52.0%, a difference of 9.5%.
2 or more Vehicles in Household Correlation Summary
| Measurement | Native/Alaskan | Immigrants from Colombia |
| Minimum | 20.0% | 14.8% |
| Maximum | 80.2% | 88.6% |
| Range | 60.2% | 73.8% |
| Mean | 56.1% | 52.2% |
| Median | 58.5% | 52.9% |
| Interquartile 25% (IQ1) | 50.1% | 42.2% |
| Interquartile 75% (IQ3) | 62.5% | 58.8% |
| Interquartile Range (IQR) | 12.4% | 16.7% |
| Standard Deviation (Sample) | 9.6% | 13.4% |
| Standard Deviation (Population) | 9.6% | 13.3% |
Similar Demographics by 2 or more Vehicles in Household
Demographics Similar to Natives/Alaskans by 2 or more Vehicles in Household
In terms of 2 or more vehicles in household, the demographic groups most similar to Natives/Alaskans are Asian (57.0%, a difference of 0.030%), Costa Rican (56.9%, a difference of 0.050%), Iraqi (57.1%, a difference of 0.19%), Sioux (56.8%, a difference of 0.21%), and Immigrants from Jordan (57.2%, a difference of 0.38%).
| Demographics | Rating | Rank | 2 or more Vehicles in Household |
| Pueblo | 98.0 /100 | #112 | Exceptional 57.5% |
| Zimbabweans | 96.9 /100 | #113 | Exceptional 57.2% |
| Immigrants | Lebanon | 96.8 /100 | #114 | Exceptional 57.2% |
| Chippewa | 96.6 /100 | #115 | Exceptional 57.2% |
| Immigrants | Jordan | 96.6 /100 | #116 | Exceptional 57.2% |
| Iraqis | 95.8 /100 | #117 | Exceptional 57.1% |
| Asians | 95.1 /100 | #118 | Exceptional 57.0% |
| Natives/Alaskans | 95.0 /100 | #119 | Exceptional 57.0% |
| Costa Ricans | 94.7 /100 | #120 | Exceptional 56.9% |
| Sioux | 93.8 /100 | #121 | Exceptional 56.8% |
| Immigrants | South Africa | 92.5 /100 | #122 | Exceptional 56.7% |
| Australians | 91.8 /100 | #123 | Exceptional 56.7% |
| New Zealanders | 91.8 /100 | #124 | Exceptional 56.7% |
| Tsimshian | 91.6 /100 | #125 | Exceptional 56.7% |
| Estonians | 90.9 /100 | #126 | Exceptional 56.6% |
Demographics Similar to Immigrants from Colombia by 2 or more Vehicles in Household
In terms of 2 or more vehicles in household, the demographic groups most similar to Immigrants from Colombia are Pima (52.0%, a difference of 0.010%), Honduran (52.0%, a difference of 0.010%), Immigrants from Ireland (52.0%, a difference of 0.040%), Immigrants from France (52.0%, a difference of 0.050%), and Immigrants from Congo (52.1%, a difference of 0.19%).
| Demographics | Rating | Rank | 2 or more Vehicles in Household |
| Immigrants | Bahamas | 0.5 /100 | #260 | Tragic 52.5% |
| Immigrants | Australia | 0.5 /100 | #261 | Tragic 52.4% |
| Immigrants | Northern Africa | 0.4 /100 | #262 | Tragic 52.3% |
| Immigrants | Southern Europe | 0.4 /100 | #263 | Tragic 52.3% |
| Immigrants | Latvia | 0.4 /100 | #264 | Tragic 52.2% |
| Immigrants | Congo | 0.3 /100 | #265 | Tragic 52.1% |
| Immigrants | France | 0.2 /100 | #266 | Tragic 52.0% |
| Immigrants | Colombia | 0.2 /100 | #267 | Tragic 52.0% |
| Pima | 0.2 /100 | #268 | Tragic 52.0% |
| Hondurans | 0.2 /100 | #269 | Tragic 52.0% |
| Immigrants | Ireland | 0.2 /100 | #270 | Tragic 52.0% |
| South Americans | 0.2 /100 | #271 | Tragic 51.9% |
| Sub-Saharan Africans | 0.2 /100 | #272 | Tragic 51.9% |
| Israelis | 0.2 /100 | #273 | Tragic 51.9% |
| Africans | 0.2 /100 | #274 | Tragic 51.8% |