Spaniard vs Immigrants from Colombia 2 or more Vehicles in Household
COMPARE
Spaniard
Immigrants from Colombia
2 or more Vehicles in Household
2 or more Vehicles in Household Comparison
Spaniards
Immigrants from Colombia
59.2%
2 OR MORE VEHICLES IN HOUSEHOLD
99.9/ 100
METRIC RATING
51st/ 347
METRIC RANK
52.0%
2 OR MORE VEHICLES IN HOUSEHOLD
0.2/ 100
METRIC RATING
267th/ 347
METRIC RANK
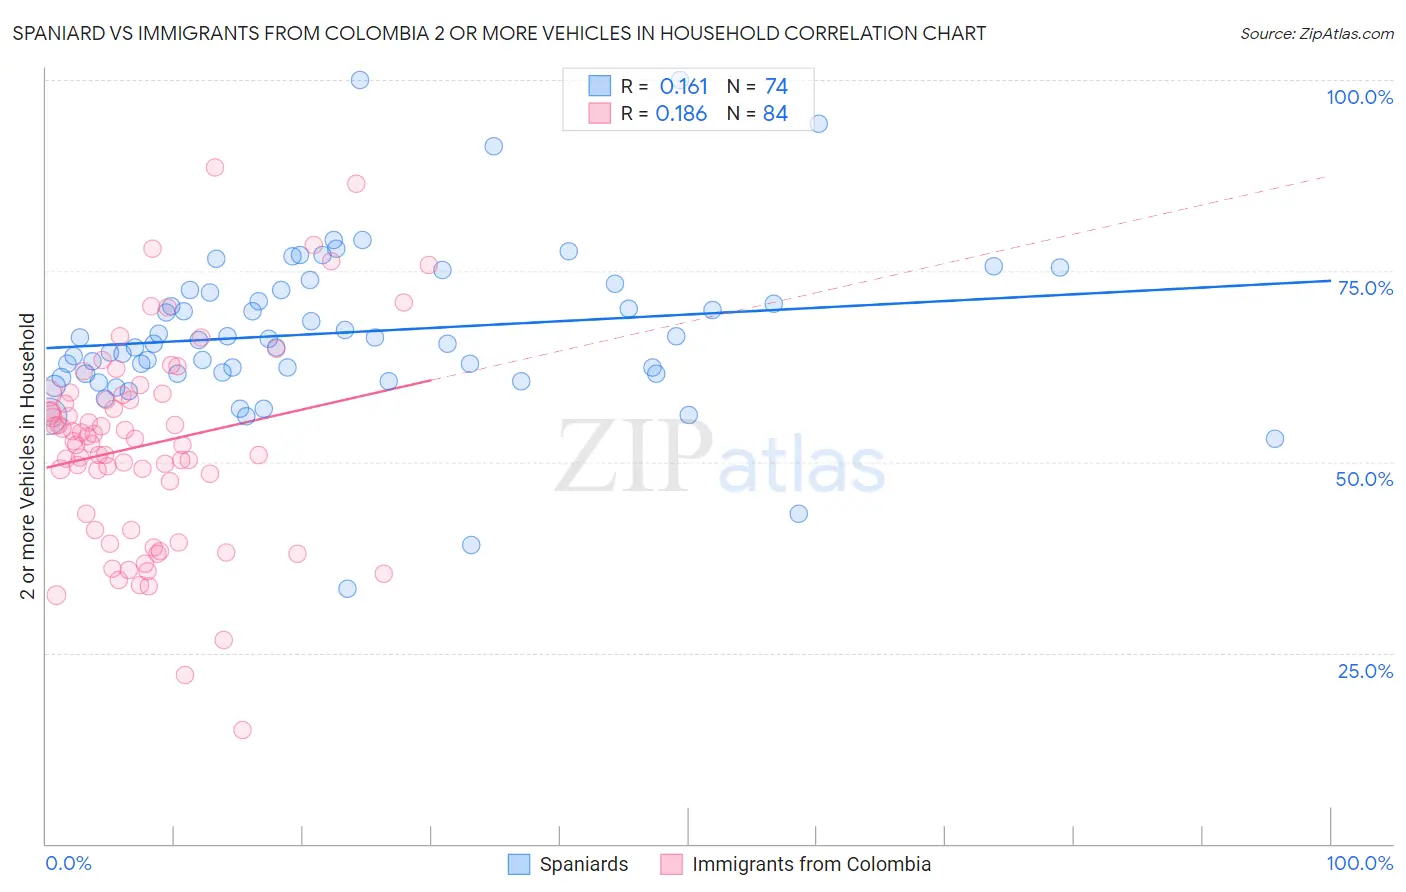
Spaniard vs Immigrants from Colombia 2 or more Vehicles in Household Correlation Chart
The statistical analysis conducted on geographies consisting of 443,212,223 people shows a poor positive correlation between the proportion of Spaniards and percentage of households with 2 or more vehicles available in the United States with a correlation coefficient (R) of 0.161 and weighted average of 59.2%. Similarly, the statistical analysis conducted on geographies consisting of 378,550,155 people shows a poor positive correlation between the proportion of Immigrants from Colombia and percentage of households with 2 or more vehicles available in the United States with a correlation coefficient (R) of 0.186 and weighted average of 52.0%, a difference of 13.8%.
2 or more Vehicles in Household Correlation Summary
| Measurement | Spaniard | Immigrants from Colombia |
| Minimum | 33.3% | 14.8% |
| Maximum | 100.0% | 88.6% |
| Range | 66.7% | 73.8% |
| Mean | 66.9% | 52.2% |
| Median | 65.8% | 52.9% |
| Interquartile 25% (IQ1) | 61.6% | 42.2% |
| Interquartile 75% (IQ3) | 72.4% | 58.8% |
| Interquartile Range (IQR) | 10.9% | 16.7% |
| Standard Deviation (Sample) | 11.0% | 13.4% |
| Standard Deviation (Population) | 10.9% | 13.3% |
Similar Demographics by 2 or more Vehicles in Household
Demographics Similar to Spaniards by 2 or more Vehicles in Household
In terms of 2 or more vehicles in household, the demographic groups most similar to Spaniards are Immigrants from Laos (59.2%, a difference of 0.0%), Celtic (59.2%, a difference of 0.020%), Choctaw (59.3%, a difference of 0.14%), Belgian (59.3%, a difference of 0.15%), and Bhutanese (59.1%, a difference of 0.16%).
| Demographics | Rating | Rank | 2 or more Vehicles in Household |
| French | 100.0 /100 | #44 | Exceptional 59.8% |
| Immigrants | Taiwan | 100.0 /100 | #45 | Exceptional 59.7% |
| Immigrants | South Eastern Asia | 100.0 /100 | #46 | Exceptional 59.6% |
| Yaqui | 99.9 /100 | #47 | Exceptional 59.3% |
| Immigrants | India | 99.9 /100 | #48 | Exceptional 59.3% |
| Belgians | 99.9 /100 | #49 | Exceptional 59.3% |
| Choctaw | 99.9 /100 | #50 | Exceptional 59.3% |
| Spaniards | 99.9 /100 | #51 | Exceptional 59.2% |
| Immigrants | Laos | 99.9 /100 | #52 | Exceptional 59.2% |
| Celtics | 99.9 /100 | #53 | Exceptional 59.2% |
| Bhutanese | 99.9 /100 | #54 | Exceptional 59.1% |
| Luxembourgers | 99.9 /100 | #55 | Exceptional 59.1% |
| Chickasaw | 99.9 /100 | #56 | Exceptional 59.0% |
| Afghans | 99.9 /100 | #57 | Exceptional 59.0% |
| Immigrants | Scotland | 99.8 /100 | #58 | Exceptional 58.9% |
Demographics Similar to Immigrants from Colombia by 2 or more Vehicles in Household
In terms of 2 or more vehicles in household, the demographic groups most similar to Immigrants from Colombia are Pima (52.0%, a difference of 0.010%), Honduran (52.0%, a difference of 0.010%), Immigrants from Ireland (52.0%, a difference of 0.040%), Immigrants from France (52.0%, a difference of 0.050%), and Immigrants from Congo (52.1%, a difference of 0.19%).
| Demographics | Rating | Rank | 2 or more Vehicles in Household |
| Immigrants | Bahamas | 0.5 /100 | #260 | Tragic 52.5% |
| Immigrants | Australia | 0.5 /100 | #261 | Tragic 52.4% |
| Immigrants | Northern Africa | 0.4 /100 | #262 | Tragic 52.3% |
| Immigrants | Southern Europe | 0.4 /100 | #263 | Tragic 52.3% |
| Immigrants | Latvia | 0.4 /100 | #264 | Tragic 52.2% |
| Immigrants | Congo | 0.3 /100 | #265 | Tragic 52.1% |
| Immigrants | France | 0.2 /100 | #266 | Tragic 52.0% |
| Immigrants | Colombia | 0.2 /100 | #267 | Tragic 52.0% |
| Pima | 0.2 /100 | #268 | Tragic 52.0% |
| Hondurans | 0.2 /100 | #269 | Tragic 52.0% |
| Immigrants | Ireland | 0.2 /100 | #270 | Tragic 52.0% |
| South Americans | 0.2 /100 | #271 | Tragic 51.9% |
| Sub-Saharan Africans | 0.2 /100 | #272 | Tragic 51.9% |
| Israelis | 0.2 /100 | #273 | Tragic 51.9% |
| Africans | 0.2 /100 | #274 | Tragic 51.8% |