Cherokee vs Arab 2 or more Vehicles in Household
COMPARE
Cherokee
Arab
2 or more Vehicles in Household
2 or more Vehicles in Household Comparison
Cherokee
Arabs
59.9%
2 OR MORE VEHICLES IN HOUSEHOLD
100.0/ 100
METRIC RATING
40th/ 347
METRIC RANK
55.0%
2 OR MORE VEHICLES IN HOUSEHOLD
35.9/ 100
METRIC RATING
185th/ 347
METRIC RANK
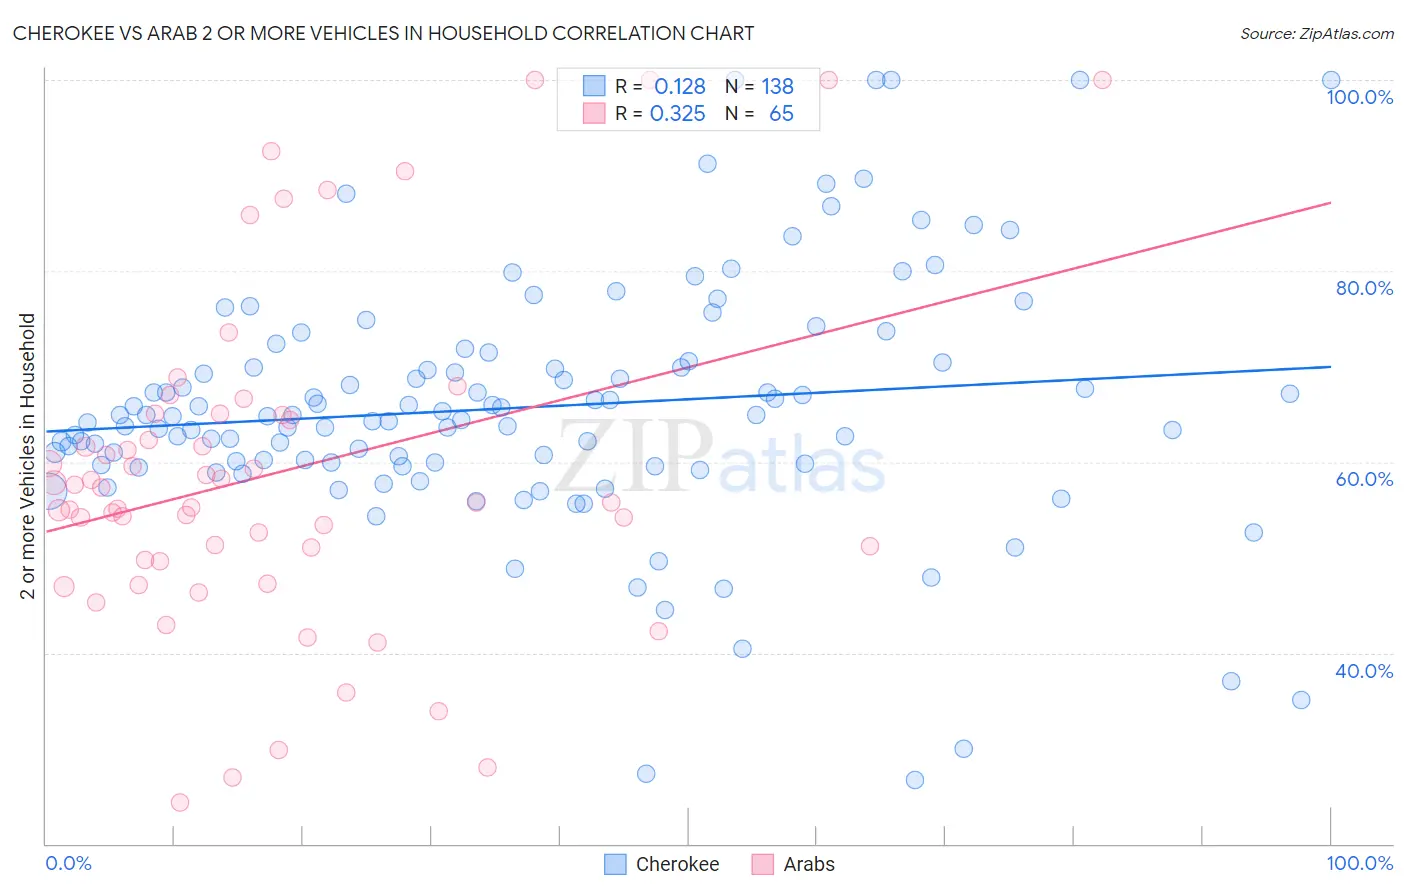
Cherokee vs Arab 2 or more Vehicles in Household Correlation Chart
The statistical analysis conducted on geographies consisting of 493,419,390 people shows a poor positive correlation between the proportion of Cherokee and percentage of households with 2 or more vehicles available in the United States with a correlation coefficient (R) of 0.128 and weighted average of 59.9%. Similarly, the statistical analysis conducted on geographies consisting of 486,450,180 people shows a mild positive correlation between the proportion of Arabs and percentage of households with 2 or more vehicles available in the United States with a correlation coefficient (R) of 0.325 and weighted average of 55.0%, a difference of 8.8%.
2 or more Vehicles in Household Correlation Summary
| Measurement | Cherokee | Arab |
| Minimum | 26.7% | 24.3% |
| Maximum | 100.0% | 100.0% |
| Range | 73.3% | 75.7% |
| Mean | 65.7% | 58.8% |
| Median | 64.8% | 55.8% |
| Interquartile 25% (IQ1) | 59.8% | 49.7% |
| Interquartile 75% (IQ3) | 70.3% | 64.9% |
| Interquartile Range (IQR) | 10.6% | 15.2% |
| Standard Deviation (Sample) | 13.1% | 17.5% |
| Standard Deviation (Population) | 13.0% | 17.4% |
Similar Demographics by 2 or more Vehicles in Household
Demographics Similar to Cherokee by 2 or more Vehicles in Household
In terms of 2 or more vehicles in household, the demographic groups most similar to Cherokee are Northern European (59.9%, a difference of 0.020%), Malaysian (59.8%, a difference of 0.030%), Czechoslovakian (59.8%, a difference of 0.11%), French (59.8%, a difference of 0.17%), and Immigrants from Taiwan (59.7%, a difference of 0.21%).
| Demographics | Rating | Rank | 2 or more Vehicles in Household |
| Immigrants | Mexico | 100.0 /100 | #33 | Exceptional 60.2% |
| Spanish | 100.0 /100 | #34 | Exceptional 60.2% |
| Immigrants | Philippines | 100.0 /100 | #35 | Exceptional 60.1% |
| Chinese | 100.0 /100 | #36 | Exceptional 60.1% |
| Irish | 100.0 /100 | #37 | Exceptional 60.1% |
| Americans | 100.0 /100 | #38 | Exceptional 60.0% |
| British | 100.0 /100 | #39 | Exceptional 60.0% |
| Cherokee | 100.0 /100 | #40 | Exceptional 59.9% |
| Northern Europeans | 100.0 /100 | #41 | Exceptional 59.9% |
| Malaysians | 100.0 /100 | #42 | Exceptional 59.8% |
| Czechoslovakians | 100.0 /100 | #43 | Exceptional 59.8% |
| French | 100.0 /100 | #44 | Exceptional 59.8% |
| Immigrants | Taiwan | 100.0 /100 | #45 | Exceptional 59.7% |
| Immigrants | South Eastern Asia | 100.0 /100 | #46 | Exceptional 59.6% |
| Yaqui | 99.9 /100 | #47 | Exceptional 59.3% |
Demographics Similar to Arabs by 2 or more Vehicles in Household
In terms of 2 or more vehicles in household, the demographic groups most similar to Arabs are Apache (55.1%, a difference of 0.030%), Immigrants from Cameroon (55.1%, a difference of 0.060%), Immigrants from Micronesia (55.1%, a difference of 0.10%), Cree (55.1%, a difference of 0.10%), and Peruvian (55.0%, a difference of 0.10%).
| Demographics | Rating | Rank | 2 or more Vehicles in Household |
| Immigrants | Sweden | 45.3 /100 | #178 | Average 55.2% |
| Alaskan Athabascans | 42.9 /100 | #179 | Average 55.2% |
| Immigrants | Kenya | 40.4 /100 | #180 | Average 55.1% |
| Immigrants | Micronesia | 38.2 /100 | #181 | Fair 55.1% |
| Cree | 38.2 /100 | #182 | Fair 55.1% |
| Immigrants | Cameroon | 37.3 /100 | #183 | Fair 55.1% |
| Apache | 36.7 /100 | #184 | Fair 55.1% |
| Arabs | 35.9 /100 | #185 | Fair 55.0% |
| Peruvians | 33.7 /100 | #186 | Fair 55.0% |
| Immigrants | Uganda | 33.4 /100 | #187 | Fair 55.0% |
| Marshallese | 30.5 /100 | #188 | Fair 54.9% |
| Eastern Europeans | 27.5 /100 | #189 | Fair 54.8% |
| Russians | 26.3 /100 | #190 | Fair 54.8% |
| Immigrants | Immigrants | 25.0 /100 | #191 | Fair 54.7% |
| Immigrants | Romania | 23.8 /100 | #192 | Fair 54.7% |