Celtic vs Puget Sound Salish 4 or more Vehicles in Household
COMPARE
Celtic
Puget Sound Salish
4 or more Vehicles in Household
4 or more Vehicles in Household Comparison
Celtics
Puget Sound Salish
7.1%
4 OR MORE VEHICLES IN HOUSEHOLD
99.1/ 100
METRIC RATING
97th/ 347
METRIC RANK
9.4%
4 OR MORE VEHICLES IN HOUSEHOLD
100.0/ 100
METRIC RATING
6th/ 347
METRIC RANK
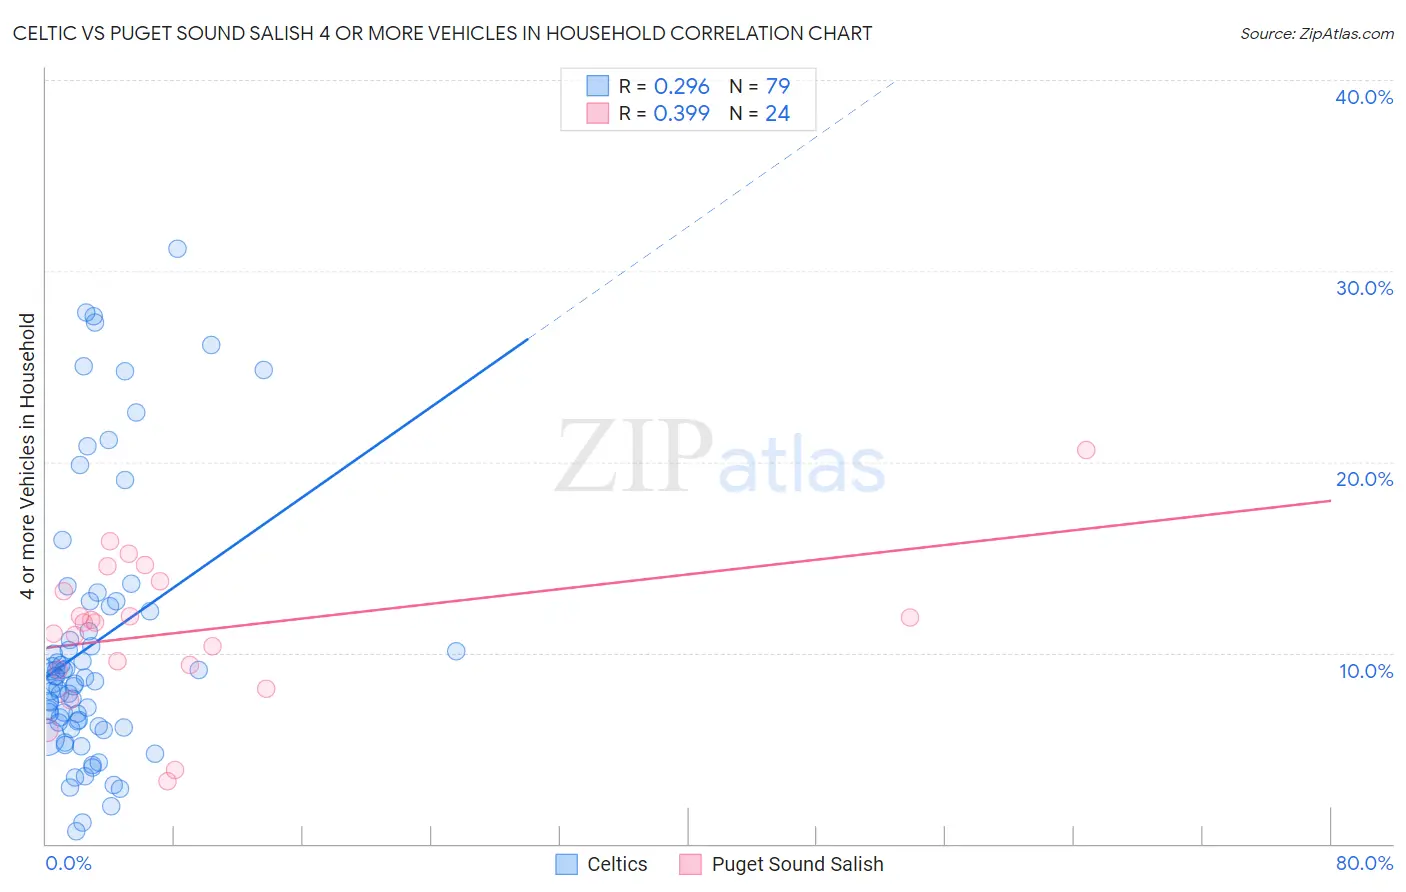
Celtic vs Puget Sound Salish 4 or more Vehicles in Household Correlation Chart
The statistical analysis conducted on geographies consisting of 168,678,221 people shows a weak positive correlation between the proportion of Celtics and percentage of households with 4 or more vehicles available in the United States with a correlation coefficient (R) of 0.296 and weighted average of 7.1%. Similarly, the statistical analysis conducted on geographies consisting of 46,139,594 people shows a mild positive correlation between the proportion of Puget Sound Salish and percentage of households with 4 or more vehicles available in the United States with a correlation coefficient (R) of 0.399 and weighted average of 9.4%, a difference of 32.5%.
4 or more Vehicles in Household Correlation Summary
| Measurement | Celtic | Puget Sound Salish |
| Minimum | 0.62% | 3.3% |
| Maximum | 31.2% | 20.6% |
| Range | 30.6% | 17.4% |
| Mean | 10.5% | 11.1% |
| Median | 8.5% | 11.6% |
| Interquartile 25% (IQ1) | 6.1% | 9.3% |
| Interquartile 75% (IQ3) | 12.5% | 13.5% |
| Interquartile Range (IQR) | 6.3% | 4.2% |
| Standard Deviation (Sample) | 7.0% | 3.8% |
| Standard Deviation (Population) | 7.0% | 3.8% |
Similar Demographics by 4 or more Vehicles in Household
Demographics Similar to Celtics by 4 or more Vehicles in Household
In terms of 4 or more vehicles in household, the demographic groups most similar to Celtics are Central American (7.1%, a difference of 0.35%), Czechoslovakian (7.1%, a difference of 0.37%), Irish (7.1%, a difference of 0.42%), Dutch West Indian (7.1%, a difference of 0.58%), and Immigrants from Afghanistan (7.1%, a difference of 0.59%).
| Demographics | Rating | Rank | 4 or more Vehicles in Household |
| Creek | 99.6 /100 | #90 | Exceptional 7.2% |
| Assyrians/Chaldeans/Syriacs | 99.4 /100 | #91 | Exceptional 7.2% |
| Immigrants | Latin America | 99.4 /100 | #92 | Exceptional 7.1% |
| Immigrants | Afghanistan | 99.3 /100 | #93 | Exceptional 7.1% |
| Dutch West Indians | 99.3 /100 | #94 | Exceptional 7.1% |
| Czechoslovakians | 99.3 /100 | #95 | Exceptional 7.1% |
| Central Americans | 99.3 /100 | #96 | Exceptional 7.1% |
| Celtics | 99.1 /100 | #97 | Exceptional 7.1% |
| Irish | 99.0 /100 | #98 | Exceptional 7.1% |
| Seminole | 98.8 /100 | #99 | Exceptional 7.0% |
| Taiwanese | 98.7 /100 | #100 | Exceptional 7.0% |
| Pakistanis | 98.7 /100 | #101 | Exceptional 7.0% |
| Asians | 98.6 /100 | #102 | Exceptional 7.0% |
| Blackfeet | 98.6 /100 | #103 | Exceptional 7.0% |
| Hmong | 98.3 /100 | #104 | Exceptional 7.0% |
Demographics Similar to Puget Sound Salish by 4 or more Vehicles in Household
In terms of 4 or more vehicles in household, the demographic groups most similar to Puget Sound Salish are Native Hawaiian (9.4%, a difference of 0.020%), Arapaho (9.4%, a difference of 0.41%), Samoan (9.2%, a difference of 1.8%), Immigrants from Fiji (9.6%, a difference of 2.5%), and Paiute (9.0%, a difference of 4.2%).
| Demographics | Rating | Rank | 4 or more Vehicles in Household |
| Yakama | 100 /100 | #1 | Exceptional 12.9% |
| Colville | 100.0 /100 | #2 | Exceptional 11.1% |
| Spanish American Indians | 100.0 /100 | #3 | Exceptional 10.8% |
| Tongans | 100.0 /100 | #4 | Exceptional 10.0% |
| Immigrants | Fiji | 100.0 /100 | #5 | Exceptional 9.6% |
| Puget Sound Salish | 100.0 /100 | #6 | Exceptional 9.4% |
| Native Hawaiians | 100.0 /100 | #7 | Exceptional 9.4% |
| Arapaho | 100.0 /100 | #8 | Exceptional 9.4% |
| Samoans | 100.0 /100 | #9 | Exceptional 9.2% |
| Paiute | 100.0 /100 | #10 | Exceptional 9.0% |
| Immigrants | Mexico | 100.0 /100 | #11 | Exceptional 9.0% |
| Mexicans | 100.0 /100 | #12 | Exceptional 8.9% |
| Hawaiians | 100.0 /100 | #13 | Exceptional 8.9% |
| Chinese | 100.0 /100 | #14 | Exceptional 8.8% |
| Shoshone | 100.0 /100 | #15 | Exceptional 8.8% |