Celtic vs Luxembourger 4 or more Vehicles in Household
COMPARE
Celtic
Luxembourger
4 or more Vehicles in Household
4 or more Vehicles in Household Comparison
Celtics
Luxembourgers
7.1%
4 OR MORE VEHICLES IN HOUSEHOLD
99.1/ 100
METRIC RATING
97th/ 347
METRIC RANK
6.6%
4 OR MORE VEHICLES IN HOUSEHOLD
86.4/ 100
METRIC RATING
136th/ 347
METRIC RANK
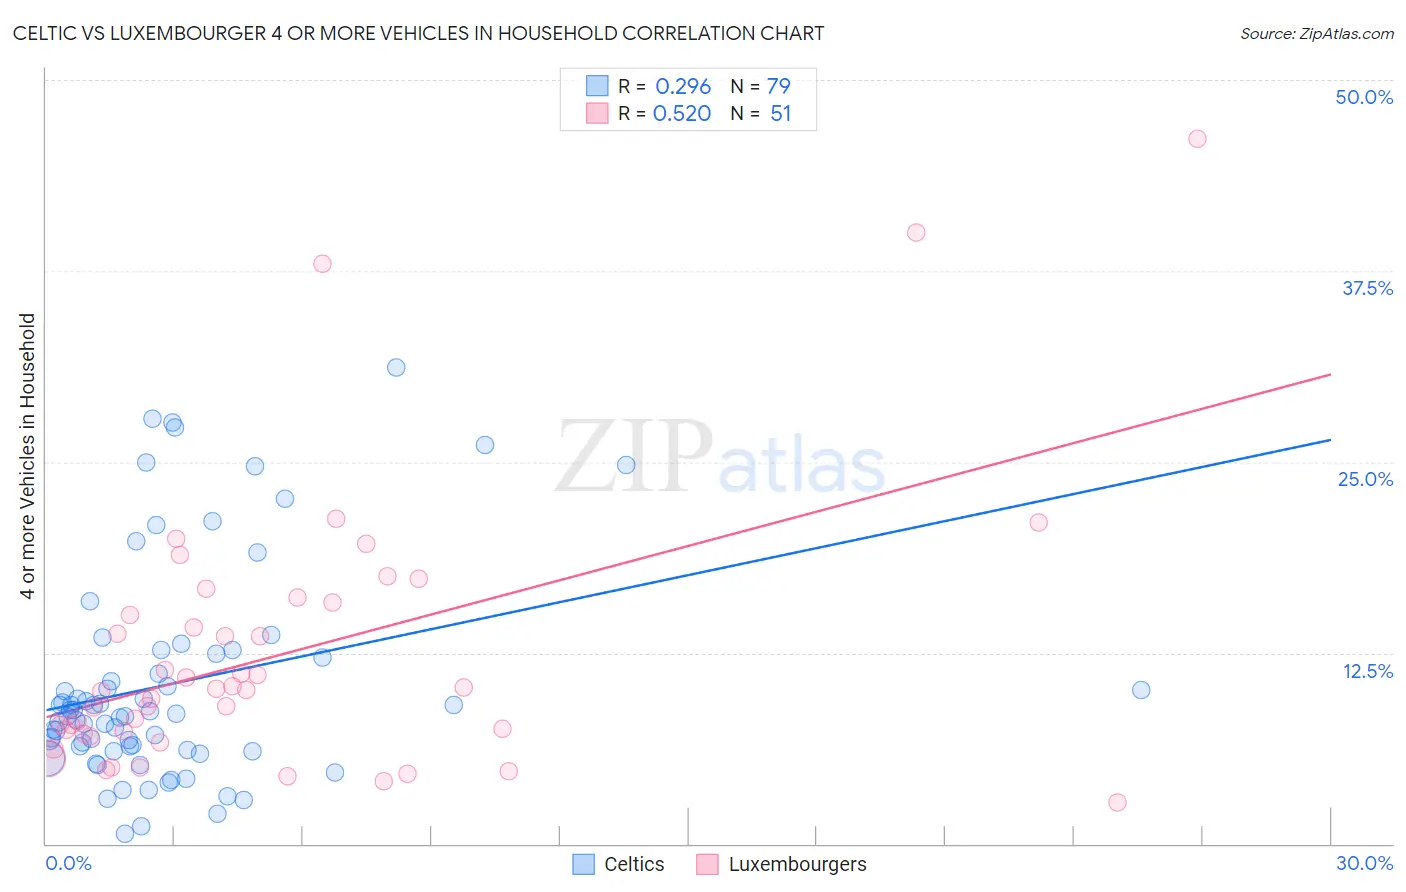
Celtic vs Luxembourger 4 or more Vehicles in Household Correlation Chart
The statistical analysis conducted on geographies consisting of 168,678,221 people shows a weak positive correlation between the proportion of Celtics and percentage of households with 4 or more vehicles available in the United States with a correlation coefficient (R) of 0.296 and weighted average of 7.1%. Similarly, the statistical analysis conducted on geographies consisting of 144,419,010 people shows a substantial positive correlation between the proportion of Luxembourgers and percentage of households with 4 or more vehicles available in the United States with a correlation coefficient (R) of 0.520 and weighted average of 6.6%, a difference of 7.0%.
4 or more Vehicles in Household Correlation Summary
| Measurement | Celtic | Luxembourger |
| Minimum | 0.62% | 2.7% |
| Maximum | 31.2% | 46.2% |
| Range | 30.6% | 43.5% |
| Mean | 10.5% | 12.4% |
| Median | 8.5% | 10.0% |
| Interquartile 25% (IQ1) | 6.1% | 7.2% |
| Interquartile 75% (IQ3) | 12.5% | 15.8% |
| Interquartile Range (IQR) | 6.3% | 8.6% |
| Standard Deviation (Sample) | 7.0% | 8.8% |
| Standard Deviation (Population) | 7.0% | 8.7% |
Similar Demographics by 4 or more Vehicles in Household
Demographics Similar to Celtics by 4 or more Vehicles in Household
In terms of 4 or more vehicles in household, the demographic groups most similar to Celtics are Central American (7.1%, a difference of 0.35%), Czechoslovakian (7.1%, a difference of 0.37%), Irish (7.1%, a difference of 0.42%), Dutch West Indian (7.1%, a difference of 0.58%), and Immigrants from Afghanistan (7.1%, a difference of 0.59%).
| Demographics | Rating | Rank | 4 or more Vehicles in Household |
| Creek | 99.6 /100 | #90 | Exceptional 7.2% |
| Assyrians/Chaldeans/Syriacs | 99.4 /100 | #91 | Exceptional 7.2% |
| Immigrants | Latin America | 99.4 /100 | #92 | Exceptional 7.1% |
| Immigrants | Afghanistan | 99.3 /100 | #93 | Exceptional 7.1% |
| Dutch West Indians | 99.3 /100 | #94 | Exceptional 7.1% |
| Czechoslovakians | 99.3 /100 | #95 | Exceptional 7.1% |
| Central Americans | 99.3 /100 | #96 | Exceptional 7.1% |
| Celtics | 99.1 /100 | #97 | Exceptional 7.1% |
| Irish | 99.0 /100 | #98 | Exceptional 7.1% |
| Seminole | 98.8 /100 | #99 | Exceptional 7.0% |
| Taiwanese | 98.7 /100 | #100 | Exceptional 7.0% |
| Pakistanis | 98.7 /100 | #101 | Exceptional 7.0% |
| Asians | 98.6 /100 | #102 | Exceptional 7.0% |
| Blackfeet | 98.6 /100 | #103 | Exceptional 7.0% |
| Hmong | 98.3 /100 | #104 | Exceptional 7.0% |
Demographics Similar to Luxembourgers by 4 or more Vehicles in Household
In terms of 4 or more vehicles in household, the demographic groups most similar to Luxembourgers are Tohono O'odham (6.6%, a difference of 0.070%), Ottawa (6.6%, a difference of 0.10%), Armenian (6.6%, a difference of 0.11%), French Canadian (6.6%, a difference of 0.21%), and Immigrants from Netherlands (6.6%, a difference of 0.31%).
| Demographics | Rating | Rank | 4 or more Vehicles in Household |
| Immigrants | England | 92.0 /100 | #129 | Exceptional 6.7% |
| Immigrants | Scotland | 89.0 /100 | #130 | Excellent 6.7% |
| Maltese | 88.4 /100 | #131 | Excellent 6.7% |
| Immigrants | Netherlands | 87.8 /100 | #132 | Excellent 6.6% |
| Armenians | 86.9 /100 | #133 | Excellent 6.6% |
| Ottawa | 86.9 /100 | #134 | Excellent 6.6% |
| Tohono O'odham | 86.7 /100 | #135 | Excellent 6.6% |
| Luxembourgers | 86.4 /100 | #136 | Excellent 6.6% |
| French Canadians | 85.4 /100 | #137 | Excellent 6.6% |
| Italians | 84.5 /100 | #138 | Excellent 6.6% |
| Jordanians | 82.1 /100 | #139 | Excellent 6.6% |
| Slavs | 81.6 /100 | #140 | Excellent 6.6% |
| Australians | 80.8 /100 | #141 | Excellent 6.6% |
| Immigrants | Iraq | 79.4 /100 | #142 | Good 6.5% |
| Immigrants | Canada | 78.6 /100 | #143 | Good 6.5% |