Immigrants from Iraq vs Puget Sound Salish 4 or more Vehicles in Household
COMPARE
Immigrants from Iraq
Puget Sound Salish
4 or more Vehicles in Household
4 or more Vehicles in Household Comparison
Immigrants from Iraq
Puget Sound Salish
6.5%
4 OR MORE VEHICLES IN HOUSEHOLD
79.4/ 100
METRIC RATING
142nd/ 347
METRIC RANK
9.4%
4 OR MORE VEHICLES IN HOUSEHOLD
100.0/ 100
METRIC RATING
6th/ 347
METRIC RANK
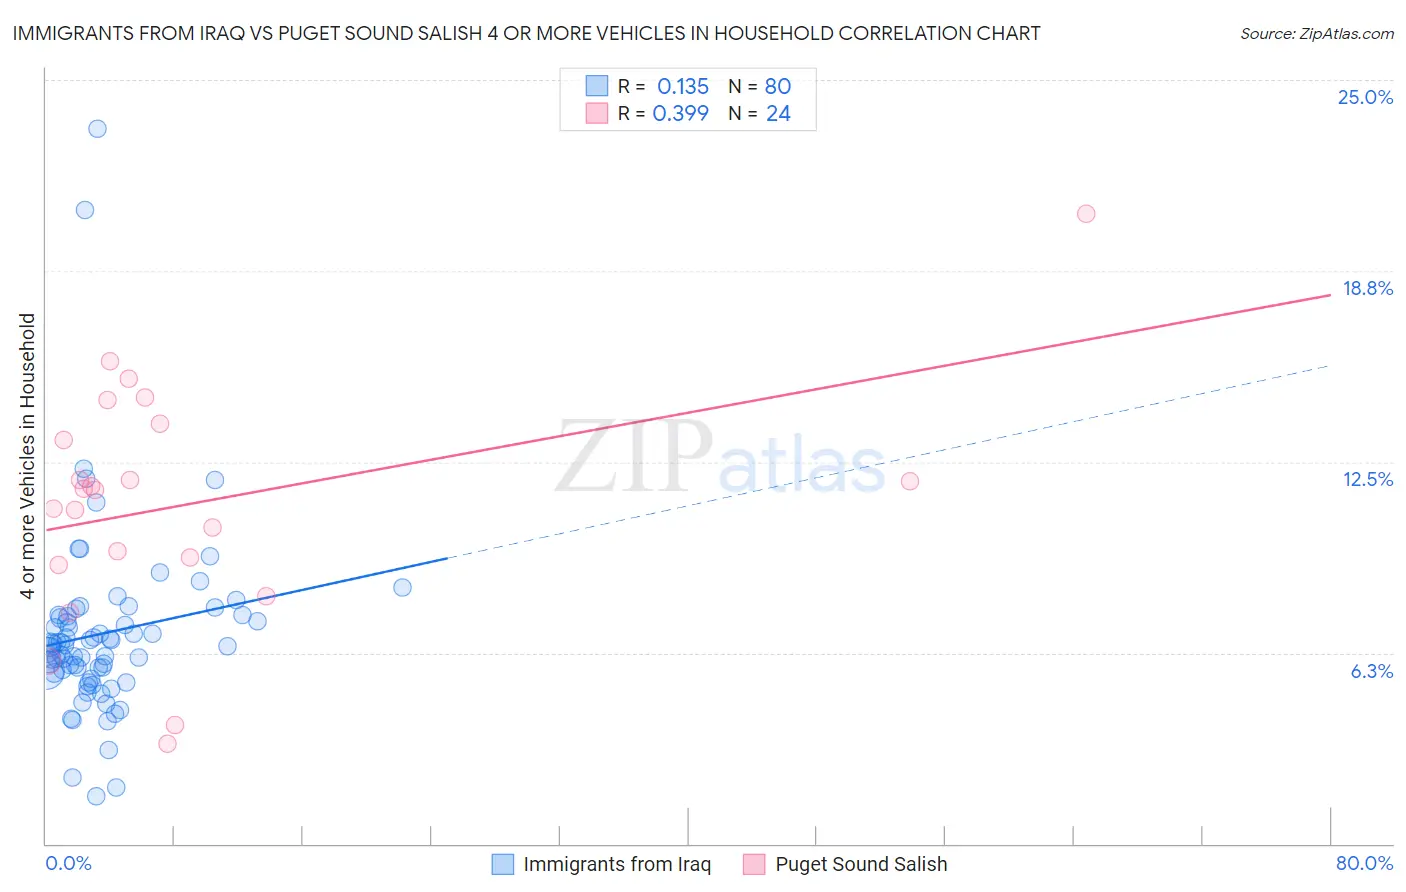
Immigrants from Iraq vs Puget Sound Salish 4 or more Vehicles in Household Correlation Chart
The statistical analysis conducted on geographies consisting of 194,531,934 people shows a poor positive correlation between the proportion of Immigrants from Iraq and percentage of households with 4 or more vehicles available in the United States with a correlation coefficient (R) of 0.135 and weighted average of 6.5%. Similarly, the statistical analysis conducted on geographies consisting of 46,139,594 people shows a mild positive correlation between the proportion of Puget Sound Salish and percentage of households with 4 or more vehicles available in the United States with a correlation coefficient (R) of 0.399 and weighted average of 9.4%, a difference of 43.5%.
4 or more Vehicles in Household Correlation Summary
| Measurement | Immigrants from Iraq | Puget Sound Salish |
| Minimum | 1.6% | 3.3% |
| Maximum | 23.4% | 20.6% |
| Range | 21.8% | 17.4% |
| Mean | 6.9% | 11.1% |
| Median | 6.5% | 11.6% |
| Interquartile 25% (IQ1) | 5.6% | 9.3% |
| Interquartile 75% (IQ3) | 7.5% | 13.5% |
| Interquartile Range (IQR) | 1.9% | 4.2% |
| Standard Deviation (Sample) | 3.1% | 3.8% |
| Standard Deviation (Population) | 3.1% | 3.8% |
Similar Demographics by 4 or more Vehicles in Household
Demographics Similar to Immigrants from Iraq by 4 or more Vehicles in Household
In terms of 4 or more vehicles in household, the demographic groups most similar to Immigrants from Iraq are Immigrants from Canada (6.5%, a difference of 0.13%), Immigrants from North America (6.5%, a difference of 0.15%), Australian (6.6%, a difference of 0.20%), Croatian (6.5%, a difference of 0.25%), and Slavic (6.6%, a difference of 0.33%).
| Demographics | Rating | Rank | 4 or more Vehicles in Household |
| Tohono O'odham | 86.7 /100 | #135 | Excellent 6.6% |
| Luxembourgers | 86.4 /100 | #136 | Excellent 6.6% |
| French Canadians | 85.4 /100 | #137 | Excellent 6.6% |
| Italians | 84.5 /100 | #138 | Excellent 6.6% |
| Jordanians | 82.1 /100 | #139 | Excellent 6.6% |
| Slavs | 81.6 /100 | #140 | Excellent 6.6% |
| Australians | 80.8 /100 | #141 | Excellent 6.6% |
| Immigrants | Iraq | 79.4 /100 | #142 | Good 6.5% |
| Immigrants | Canada | 78.6 /100 | #143 | Good 6.5% |
| Immigrants | North America | 78.5 /100 | #144 | Good 6.5% |
| Croatians | 77.8 /100 | #145 | Good 6.5% |
| Immigrants | Costa Rica | 74.4 /100 | #146 | Good 6.5% |
| Immigrants | Iran | 73.9 /100 | #147 | Good 6.5% |
| Immigrants | Jordan | 73.7 /100 | #148 | Good 6.5% |
| Greeks | 73.6 /100 | #149 | Good 6.5% |
Demographics Similar to Puget Sound Salish by 4 or more Vehicles in Household
In terms of 4 or more vehicles in household, the demographic groups most similar to Puget Sound Salish are Native Hawaiian (9.4%, a difference of 0.020%), Arapaho (9.4%, a difference of 0.41%), Samoan (9.2%, a difference of 1.8%), Immigrants from Fiji (9.6%, a difference of 2.5%), and Paiute (9.0%, a difference of 4.2%).
| Demographics | Rating | Rank | 4 or more Vehicles in Household |
| Yakama | 100 /100 | #1 | Exceptional 12.9% |
| Colville | 100.0 /100 | #2 | Exceptional 11.1% |
| Spanish American Indians | 100.0 /100 | #3 | Exceptional 10.8% |
| Tongans | 100.0 /100 | #4 | Exceptional 10.0% |
| Immigrants | Fiji | 100.0 /100 | #5 | Exceptional 9.6% |
| Puget Sound Salish | 100.0 /100 | #6 | Exceptional 9.4% |
| Native Hawaiians | 100.0 /100 | #7 | Exceptional 9.4% |
| Arapaho | 100.0 /100 | #8 | Exceptional 9.4% |
| Samoans | 100.0 /100 | #9 | Exceptional 9.2% |
| Paiute | 100.0 /100 | #10 | Exceptional 9.0% |
| Immigrants | Mexico | 100.0 /100 | #11 | Exceptional 9.0% |
| Mexicans | 100.0 /100 | #12 | Exceptional 8.9% |
| Hawaiians | 100.0 /100 | #13 | Exceptional 8.9% |
| Chinese | 100.0 /100 | #14 | Exceptional 8.8% |
| Shoshone | 100.0 /100 | #15 | Exceptional 8.8% |