Spanish American Indian vs Puget Sound Salish 4 or more Vehicles in Household
COMPARE
Spanish American Indian
Puget Sound Salish
4 or more Vehicles in Household
4 or more Vehicles in Household Comparison
Spanish American Indians
Puget Sound Salish
10.8%
4 OR MORE VEHICLES IN HOUSEHOLD
100.0/ 100
METRIC RATING
3rd/ 347
METRIC RANK
9.4%
4 OR MORE VEHICLES IN HOUSEHOLD
100.0/ 100
METRIC RATING
6th/ 347
METRIC RANK
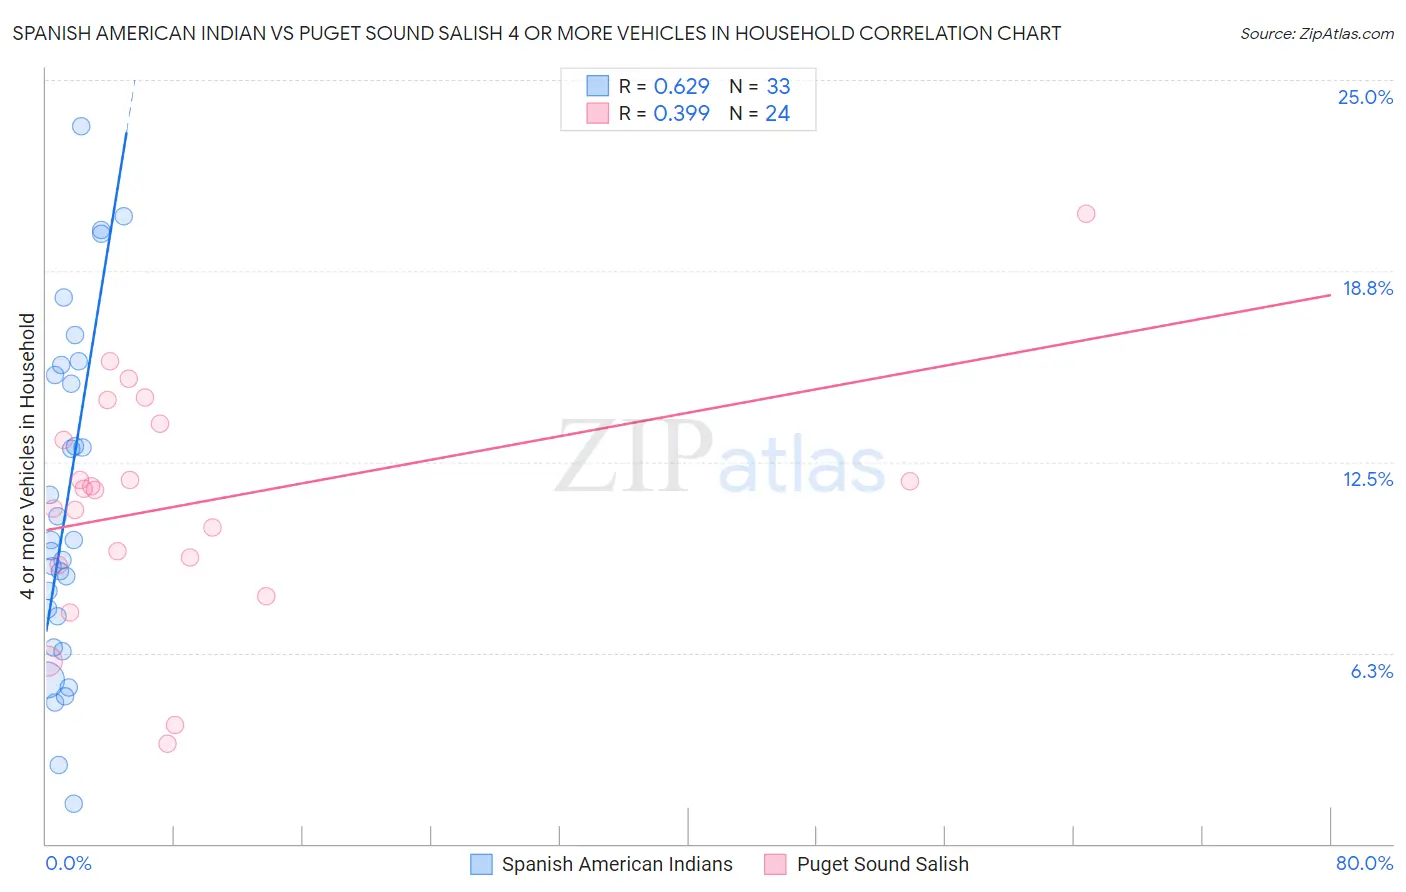
Spanish American Indian vs Puget Sound Salish 4 or more Vehicles in Household Correlation Chart
The statistical analysis conducted on geographies consisting of 73,144,698 people shows a significant positive correlation between the proportion of Spanish American Indians and percentage of households with 4 or more vehicles available in the United States with a correlation coefficient (R) of 0.629 and weighted average of 10.8%. Similarly, the statistical analysis conducted on geographies consisting of 46,139,594 people shows a mild positive correlation between the proportion of Puget Sound Salish and percentage of households with 4 or more vehicles available in the United States with a correlation coefficient (R) of 0.399 and weighted average of 9.4%, a difference of 14.7%.
4 or more Vehicles in Household Correlation Summary
| Measurement | Spanish American Indian | Puget Sound Salish |
| Minimum | 1.3% | 3.3% |
| Maximum | 23.5% | 20.6% |
| Range | 22.2% | 17.4% |
| Mean | 11.1% | 11.1% |
| Median | 9.9% | 11.6% |
| Interquartile 25% (IQ1) | 6.9% | 9.3% |
| Interquartile 75% (IQ3) | 15.5% | 13.5% |
| Interquartile Range (IQR) | 8.6% | 4.2% |
| Standard Deviation (Sample) | 5.5% | 3.8% |
| Standard Deviation (Population) | 5.5% | 3.8% |
Demographics Similar to Spanish American Indians and Puget Sound Salish by 4 or more Vehicles in Household
In terms of 4 or more vehicles in household, the demographic groups most similar to Spanish American Indians are Colville (11.1%, a difference of 3.5%), Tongan (10.0%, a difference of 7.3%), Immigrants from Fiji (9.6%, a difference of 11.9%), Native Hawaiian (9.4%, a difference of 14.7%), and Arapaho (9.4%, a difference of 15.2%). Similarly, the demographic groups most similar to Puget Sound Salish are Native Hawaiian (9.4%, a difference of 0.020%), Arapaho (9.4%, a difference of 0.41%), Samoan (9.2%, a difference of 1.8%), Immigrants from Fiji (9.6%, a difference of 2.5%), and Paiute (9.0%, a difference of 4.2%).
| Demographics | Rating | Rank | 4 or more Vehicles in Household |
| Yakama | 100 /100 | #1 | Exceptional 12.9% |
| Colville | 100.0 /100 | #2 | Exceptional 11.1% |
| Spanish American Indians | 100.0 /100 | #3 | Exceptional 10.8% |
| Tongans | 100.0 /100 | #4 | Exceptional 10.0% |
| Immigrants | Fiji | 100.0 /100 | #5 | Exceptional 9.6% |
| Puget Sound Salish | 100.0 /100 | #6 | Exceptional 9.4% |
| Native Hawaiians | 100.0 /100 | #7 | Exceptional 9.4% |
| Arapaho | 100.0 /100 | #8 | Exceptional 9.4% |
| Samoans | 100.0 /100 | #9 | Exceptional 9.2% |
| Paiute | 100.0 /100 | #10 | Exceptional 9.0% |
| Immigrants | Mexico | 100.0 /100 | #11 | Exceptional 9.0% |
| Mexicans | 100.0 /100 | #12 | Exceptional 8.9% |
| Hawaiians | 100.0 /100 | #13 | Exceptional 8.9% |
| Chinese | 100.0 /100 | #14 | Exceptional 8.8% |
| Shoshone | 100.0 /100 | #15 | Exceptional 8.8% |
| Lumbee | 100.0 /100 | #16 | Exceptional 8.8% |
| Ute | 100.0 /100 | #17 | Exceptional 8.8% |
| Nepalese | 100.0 /100 | #18 | Exceptional 8.7% |
| Koreans | 100.0 /100 | #19 | Exceptional 8.6% |
| Pueblo | 100.0 /100 | #20 | Exceptional 8.6% |