Celtic vs Ghanaian 4 or more Vehicles in Household
COMPARE
Celtic
Ghanaian
4 or more Vehicles in Household
4 or more Vehicles in Household Comparison
Celtics
Ghanaians
7.1%
4 OR MORE VEHICLES IN HOUSEHOLD
99.1/ 100
METRIC RATING
97th/ 347
METRIC RANK
5.2%
4 OR MORE VEHICLES IN HOUSEHOLD
0.1/ 100
METRIC RATING
294th/ 347
METRIC RANK
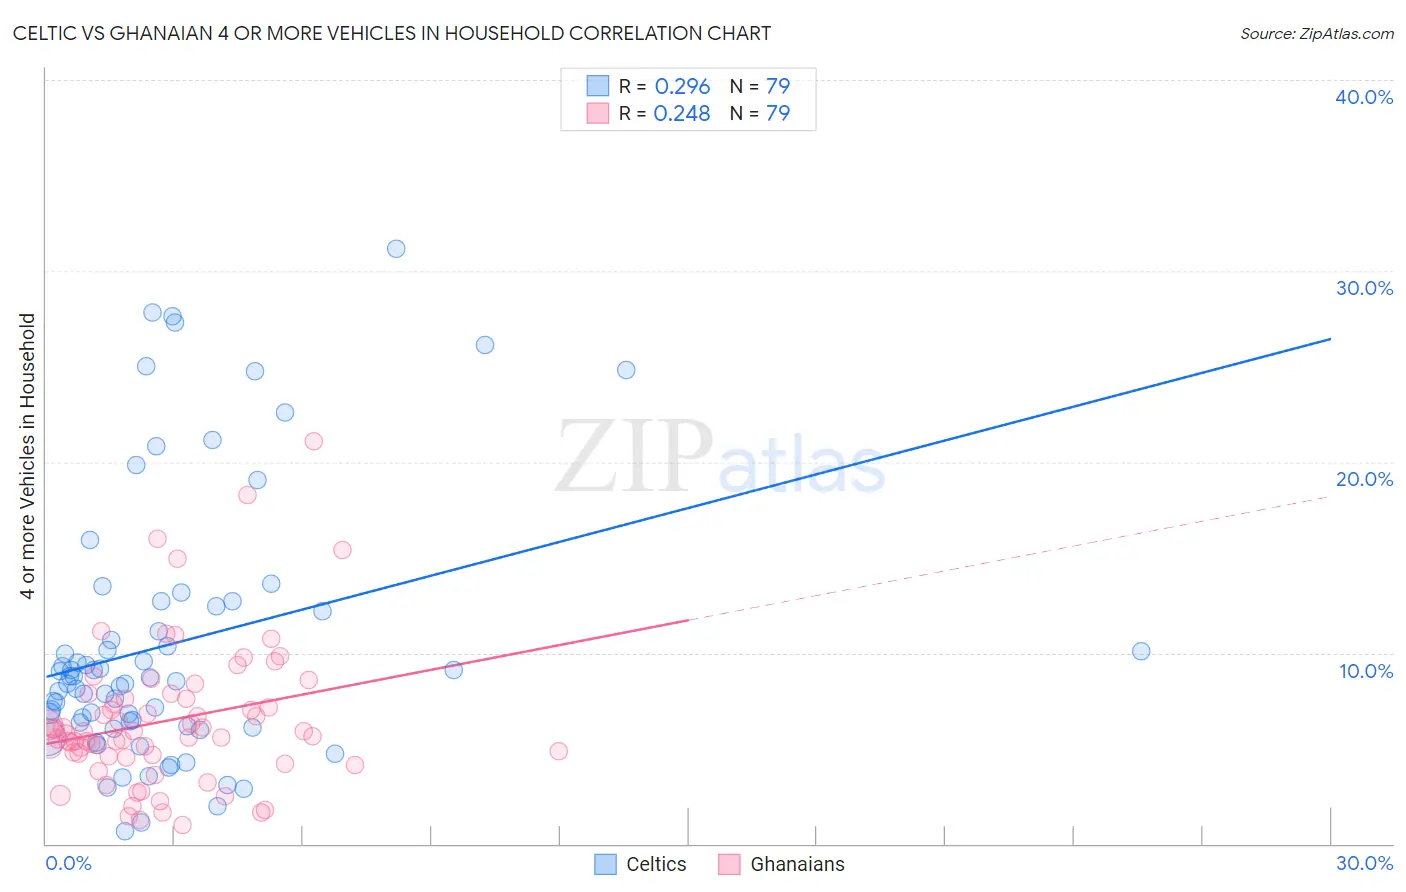
Celtic vs Ghanaian 4 or more Vehicles in Household Correlation Chart
The statistical analysis conducted on geographies consisting of 168,678,221 people shows a weak positive correlation between the proportion of Celtics and percentage of households with 4 or more vehicles available in the United States with a correlation coefficient (R) of 0.296 and weighted average of 7.1%. Similarly, the statistical analysis conducted on geographies consisting of 189,616,639 people shows a weak positive correlation between the proportion of Ghanaians and percentage of households with 4 or more vehicles available in the United States with a correlation coefficient (R) of 0.248 and weighted average of 5.2%, a difference of 35.1%.
4 or more Vehicles in Household Correlation Summary
| Measurement | Celtic | Ghanaian |
| Minimum | 0.62% | 0.97% |
| Maximum | 31.2% | 21.1% |
| Range | 30.6% | 20.1% |
| Mean | 10.5% | 6.4% |
| Median | 8.5% | 5.8% |
| Interquartile 25% (IQ1) | 6.1% | 4.6% |
| Interquartile 75% (IQ3) | 12.5% | 7.6% |
| Interquartile Range (IQR) | 6.3% | 3.1% |
| Standard Deviation (Sample) | 7.0% | 3.7% |
| Standard Deviation (Population) | 7.0% | 3.7% |
Similar Demographics by 4 or more Vehicles in Household
Demographics Similar to Celtics by 4 or more Vehicles in Household
In terms of 4 or more vehicles in household, the demographic groups most similar to Celtics are Central American (7.1%, a difference of 0.35%), Czechoslovakian (7.1%, a difference of 0.37%), Irish (7.1%, a difference of 0.42%), Dutch West Indian (7.1%, a difference of 0.58%), and Immigrants from Afghanistan (7.1%, a difference of 0.59%).
| Demographics | Rating | Rank | 4 or more Vehicles in Household |
| Creek | 99.6 /100 | #90 | Exceptional 7.2% |
| Assyrians/Chaldeans/Syriacs | 99.4 /100 | #91 | Exceptional 7.2% |
| Immigrants | Latin America | 99.4 /100 | #92 | Exceptional 7.1% |
| Immigrants | Afghanistan | 99.3 /100 | #93 | Exceptional 7.1% |
| Dutch West Indians | 99.3 /100 | #94 | Exceptional 7.1% |
| Czechoslovakians | 99.3 /100 | #95 | Exceptional 7.1% |
| Central Americans | 99.3 /100 | #96 | Exceptional 7.1% |
| Celtics | 99.1 /100 | #97 | Exceptional 7.1% |
| Irish | 99.0 /100 | #98 | Exceptional 7.1% |
| Seminole | 98.8 /100 | #99 | Exceptional 7.0% |
| Taiwanese | 98.7 /100 | #100 | Exceptional 7.0% |
| Pakistanis | 98.7 /100 | #101 | Exceptional 7.0% |
| Asians | 98.6 /100 | #102 | Exceptional 7.0% |
| Blackfeet | 98.6 /100 | #103 | Exceptional 7.0% |
| Hmong | 98.3 /100 | #104 | Exceptional 7.0% |
Demographics Similar to Ghanaians by 4 or more Vehicles in Household
In terms of 4 or more vehicles in household, the demographic groups most similar to Ghanaians are Immigrants from Congo (5.2%, a difference of 0.050%), Liberian (5.3%, a difference of 0.090%), Immigrants from Brazil (5.2%, a difference of 0.11%), Immigrants from Bahamas (5.3%, a difference of 0.19%), and Israeli (5.2%, a difference of 0.29%).
| Demographics | Rating | Rank | 4 or more Vehicles in Household |
| Immigrants | Croatia | 0.2 /100 | #287 | Tragic 5.4% |
| Venezuelans | 0.2 /100 | #288 | Tragic 5.3% |
| Immigrants | Bosnia and Herzegovina | 0.2 /100 | #289 | Tragic 5.3% |
| Immigrants | Russia | 0.2 /100 | #290 | Tragic 5.3% |
| Immigrants | Bahamas | 0.1 /100 | #291 | Tragic 5.3% |
| Liberians | 0.1 /100 | #292 | Tragic 5.3% |
| Immigrants | Congo | 0.1 /100 | #293 | Tragic 5.2% |
| Ghanaians | 0.1 /100 | #294 | Tragic 5.2% |
| Immigrants | Brazil | 0.1 /100 | #295 | Tragic 5.2% |
| Israelis | 0.1 /100 | #296 | Tragic 5.2% |
| Immigrants | Venezuela | 0.1 /100 | #297 | Tragic 5.2% |
| Immigrants | South America | 0.1 /100 | #298 | Tragic 5.2% |
| Immigrants | Ghana | 0.1 /100 | #299 | Tragic 5.2% |
| Immigrants | Morocco | 0.0 /100 | #300 | Tragic 5.1% |
| Immigrants | Zaire | 0.0 /100 | #301 | Tragic 5.1% |