Celtic vs Delaware 4 or more Vehicles in Household
COMPARE
Celtic
Delaware
4 or more Vehicles in Household
4 or more Vehicles in Household Comparison
Celtics
Delaware
7.1%
4 OR MORE VEHICLES IN HOUSEHOLD
99.1/ 100
METRIC RATING
97th/ 347
METRIC RANK
7.2%
4 OR MORE VEHICLES IN HOUSEHOLD
99.6/ 100
METRIC RATING
87th/ 347
METRIC RANK
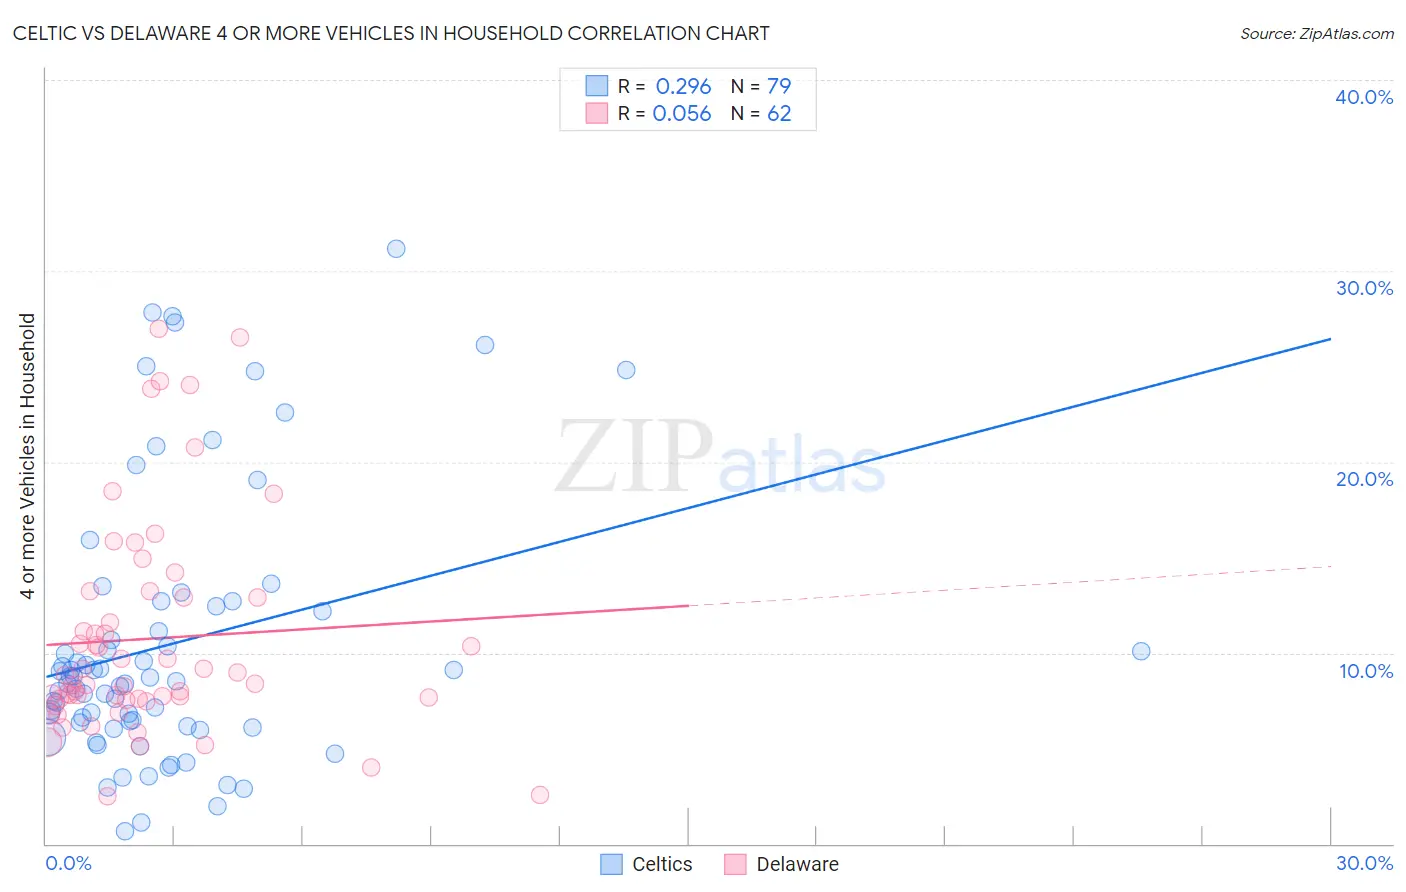
Celtic vs Delaware 4 or more Vehicles in Household Correlation Chart
The statistical analysis conducted on geographies consisting of 168,678,221 people shows a weak positive correlation between the proportion of Celtics and percentage of households with 4 or more vehicles available in the United States with a correlation coefficient (R) of 0.296 and weighted average of 7.1%. Similarly, the statistical analysis conducted on geographies consisting of 96,077,939 people shows a slight positive correlation between the proportion of Delaware and percentage of households with 4 or more vehicles available in the United States with a correlation coefficient (R) of 0.056 and weighted average of 7.2%, a difference of 1.9%.
4 or more Vehicles in Household Correlation Summary
| Measurement | Celtic | Delaware |
| Minimum | 0.62% | 2.5% |
| Maximum | 31.2% | 27.0% |
| Range | 30.6% | 24.5% |
| Mean | 10.5% | 10.7% |
| Median | 8.5% | 8.6% |
| Interquartile 25% (IQ1) | 6.1% | 7.6% |
| Interquartile 75% (IQ3) | 12.5% | 12.9% |
| Interquartile Range (IQR) | 6.3% | 5.3% |
| Standard Deviation (Sample) | 7.0% | 5.7% |
| Standard Deviation (Population) | 7.0% | 5.6% |
Demographics Similar to Celtics and Delaware by 4 or more Vehicles in Household
In terms of 4 or more vehicles in household, the demographic groups most similar to Celtics are Central American (7.1%, a difference of 0.35%), Czechoslovakian (7.1%, a difference of 0.37%), Irish (7.1%, a difference of 0.42%), Dutch West Indian (7.1%, a difference of 0.58%), and Immigrants from Afghanistan (7.1%, a difference of 0.59%). Similarly, the demographic groups most similar to Delaware are Nonimmigrants (7.2%, a difference of 0.020%), Immigrants from Indonesia (7.2%, a difference of 0.060%), Cree (7.2%, a difference of 0.24%), British (7.2%, a difference of 0.35%), and Afghan (7.3%, a difference of 0.41%).
| Demographics | Rating | Rank | 4 or more Vehicles in Household |
| Northern Europeans | 99.8 /100 | #82 | Exceptional 7.3% |
| Potawatomi | 99.7 /100 | #83 | Exceptional 7.3% |
| Afghans | 99.7 /100 | #84 | Exceptional 7.3% |
| Cree | 99.7 /100 | #85 | Exceptional 7.2% |
| Immigrants | Indonesia | 99.6 /100 | #86 | Exceptional 7.2% |
| Delaware | 99.6 /100 | #87 | Exceptional 7.2% |
| Immigrants | Nonimmigrants | 99.6 /100 | #88 | Exceptional 7.2% |
| British | 99.6 /100 | #89 | Exceptional 7.2% |
| Creek | 99.6 /100 | #90 | Exceptional 7.2% |
| Assyrians/Chaldeans/Syriacs | 99.4 /100 | #91 | Exceptional 7.2% |
| Immigrants | Latin America | 99.4 /100 | #92 | Exceptional 7.1% |
| Immigrants | Afghanistan | 99.3 /100 | #93 | Exceptional 7.1% |
| Dutch West Indians | 99.3 /100 | #94 | Exceptional 7.1% |
| Czechoslovakians | 99.3 /100 | #95 | Exceptional 7.1% |
| Central Americans | 99.3 /100 | #96 | Exceptional 7.1% |
| Celtics | 99.1 /100 | #97 | Exceptional 7.1% |
| Irish | 99.0 /100 | #98 | Exceptional 7.1% |
| Seminole | 98.8 /100 | #99 | Exceptional 7.0% |
| Taiwanese | 98.7 /100 | #100 | Exceptional 7.0% |
| Pakistanis | 98.7 /100 | #101 | Exceptional 7.0% |
| Asians | 98.6 /100 | #102 | Exceptional 7.0% |