Cajun vs Immigrants from Moldova Male Disability
COMPARE
Cajun
Immigrants from Moldova
Male Disability
Male Disability Comparison
Cajuns
Immigrants from Moldova
14.4%
MALE DISABILITY
0.0/ 100
METRIC RATING
329th/ 347
METRIC RANK
11.1%
MALE DISABILITY
72.8/ 100
METRIC RATING
154th/ 347
METRIC RANK
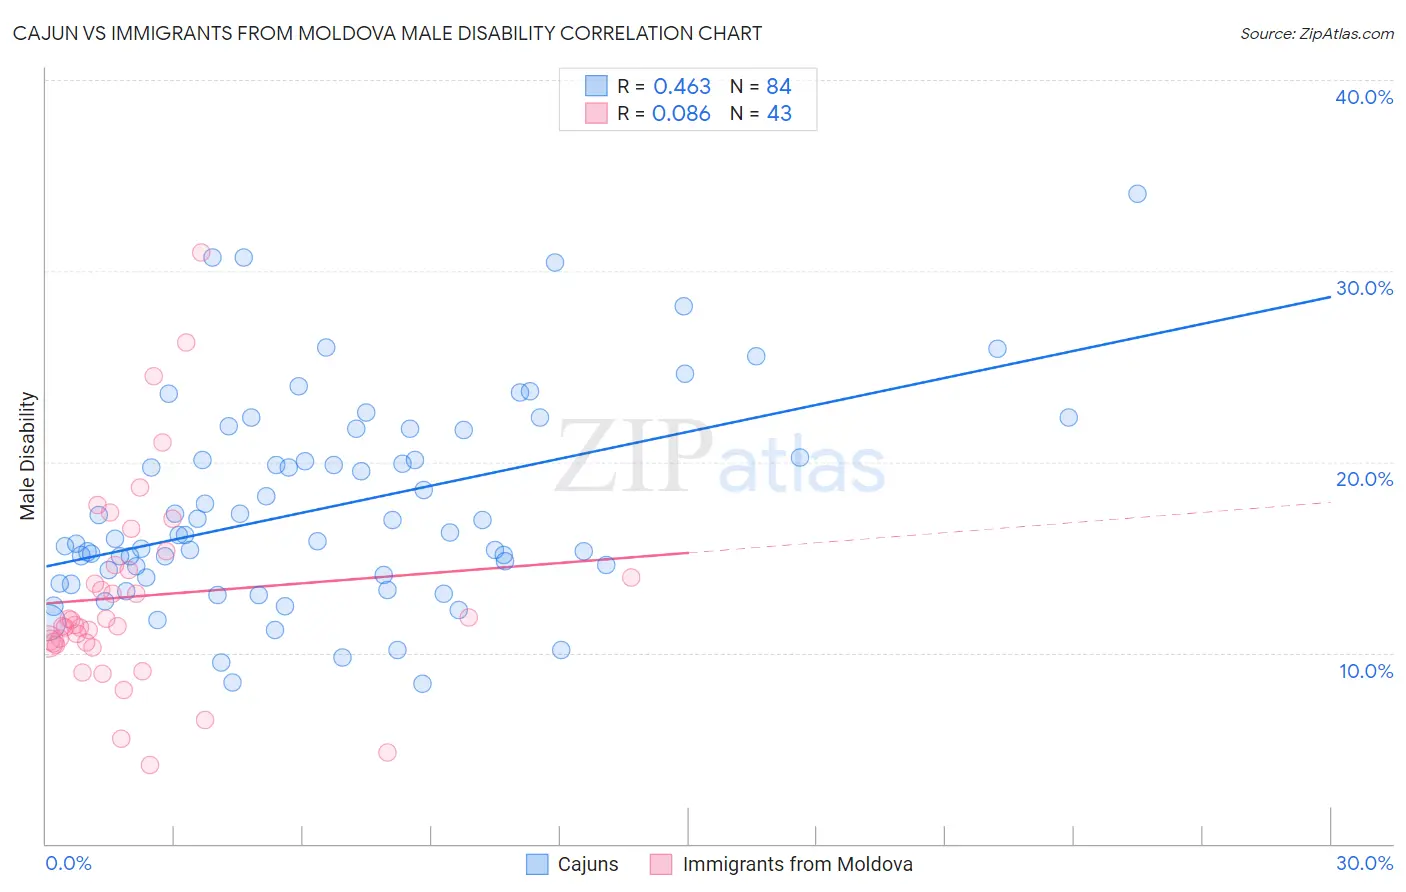
Cajun vs Immigrants from Moldova Male Disability Correlation Chart
The statistical analysis conducted on geographies consisting of 149,697,026 people shows a moderate positive correlation between the proportion of Cajuns and percentage of males with a disability in the United States with a correlation coefficient (R) of 0.463 and weighted average of 14.4%. Similarly, the statistical analysis conducted on geographies consisting of 124,384,403 people shows a slight positive correlation between the proportion of Immigrants from Moldova and percentage of males with a disability in the United States with a correlation coefficient (R) of 0.086 and weighted average of 11.1%, a difference of 29.8%.
Male Disability Correlation Summary
| Measurement | Cajun | Immigrants from Moldova |
| Minimum | 8.4% | 4.1% |
| Maximum | 34.1% | 31.0% |
| Range | 25.7% | 26.8% |
| Mean | 17.7% | 13.0% |
| Median | 16.2% | 11.5% |
| Interquartile 25% (IQ1) | 14.0% | 10.5% |
| Interquartile 75% (IQ3) | 21.0% | 14.6% |
| Interquartile Range (IQR) | 7.0% | 4.1% |
| Standard Deviation (Sample) | 5.4% | 5.3% |
| Standard Deviation (Population) | 5.4% | 5.3% |
Similar Demographics by Male Disability
Demographics Similar to Cajuns by Male Disability
In terms of male disability, the demographic groups most similar to Cajuns are Navajo (14.4%, a difference of 0.23%), Chippewa (14.3%, a difference of 0.57%), Potawatomi (14.2%, a difference of 1.0%), Native/Alaskan (14.2%, a difference of 1.1%), and Tohono O'odham (14.6%, a difference of 1.7%).
| Demographics | Rating | Rank | Male Disability |
| Apache | 0.0 /100 | #322 | Tragic 14.0% |
| Osage | 0.0 /100 | #323 | Tragic 14.0% |
| Comanche | 0.0 /100 | #324 | Tragic 14.1% |
| Ottawa | 0.0 /100 | #325 | Tragic 14.1% |
| Natives/Alaskans | 0.0 /100 | #326 | Tragic 14.2% |
| Potawatomi | 0.0 /100 | #327 | Tragic 14.2% |
| Chippewa | 0.0 /100 | #328 | Tragic 14.3% |
| Cajuns | 0.0 /100 | #329 | Tragic 14.4% |
| Navajo | 0.0 /100 | #330 | Tragic 14.4% |
| Tohono O'odham | 0.0 /100 | #331 | Tragic 14.6% |
| Seminole | 0.0 /100 | #332 | Tragic 14.7% |
| Yuman | 0.0 /100 | #333 | Tragic 14.7% |
| Cherokee | 0.0 /100 | #334 | Tragic 14.8% |
| Dutch West Indians | 0.0 /100 | #335 | Tragic 14.8% |
| Alaskan Athabascans | 0.0 /100 | #336 | Tragic 14.9% |
Demographics Similar to Immigrants from Moldova by Male Disability
In terms of male disability, the demographic groups most similar to Immigrants from Moldova are Immigrants from Northern Europe (11.1%, a difference of 0.020%), Immigrants from Albania (11.0%, a difference of 0.11%), Immigrants from Middle Africa (11.1%, a difference of 0.14%), Cuban (11.0%, a difference of 0.15%), and Immigrants from Guatemala (11.0%, a difference of 0.17%).
| Demographics | Rating | Rank | Male Disability |
| Immigrants | Croatia | 77.3 /100 | #147 | Good 11.0% |
| Sudanese | 77.1 /100 | #148 | Good 11.0% |
| Immigrants | Denmark | 76.4 /100 | #149 | Good 11.0% |
| Immigrants | Guatemala | 75.1 /100 | #150 | Good 11.0% |
| Cubans | 74.9 /100 | #151 | Good 11.0% |
| Immigrants | Albania | 74.4 /100 | #152 | Good 11.0% |
| Immigrants | Northern Europe | 73.2 /100 | #153 | Good 11.1% |
| Immigrants | Moldova | 72.8 /100 | #154 | Good 11.1% |
| Immigrants | Middle Africa | 70.9 /100 | #155 | Good 11.1% |
| Russians | 69.8 /100 | #156 | Good 11.1% |
| Immigrants | Western Africa | 69.2 /100 | #157 | Good 11.1% |
| Latvians | 68.1 /100 | #158 | Good 11.1% |
| Guatemalans | 67.2 /100 | #159 | Good 11.1% |
| Albanians | 66.5 /100 | #160 | Good 11.1% |
| Immigrants | West Indies | 65.7 /100 | #161 | Good 11.1% |