Cajun vs Immigrants from Moldova Vision Disability
COMPARE
Cajun
Immigrants from Moldova
Vision Disability
Vision Disability Comparison
Cajuns
Immigrants from Moldova
3.1%
VISION DISABILITY
0.0/ 100
METRIC RATING
333rd/ 347
METRIC RANK
2.0%
VISION DISABILITY
97.2/ 100
METRIC RATING
86th/ 347
METRIC RANK
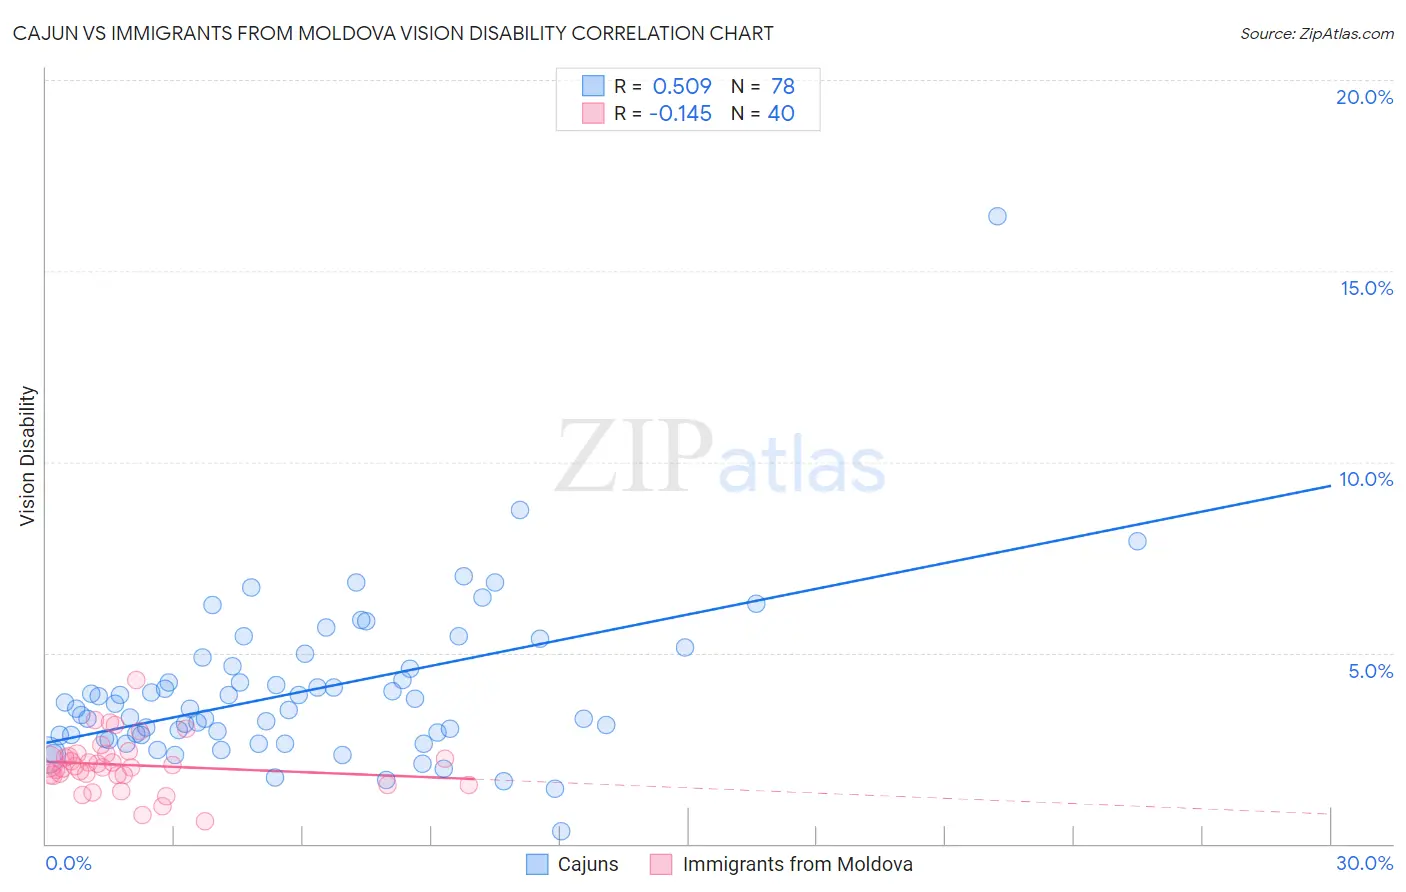
Cajun vs Immigrants from Moldova Vision Disability Correlation Chart
The statistical analysis conducted on geographies consisting of 149,649,677 people shows a substantial positive correlation between the proportion of Cajuns and percentage of population with vision disability in the United States with a correlation coefficient (R) of 0.509 and weighted average of 3.1%. Similarly, the statistical analysis conducted on geographies consisting of 124,355,490 people shows a poor negative correlation between the proportion of Immigrants from Moldova and percentage of population with vision disability in the United States with a correlation coefficient (R) of -0.145 and weighted average of 2.0%, a difference of 49.5%.
Vision Disability Correlation Summary
| Measurement | Cajun | Immigrants from Moldova |
| Minimum | 0.34% | 0.59% |
| Maximum | 16.4% | 4.3% |
| Range | 16.1% | 3.7% |
| Mean | 4.0% | 2.1% |
| Median | 3.5% | 2.0% |
| Interquartile 25% (IQ1) | 2.8% | 1.8% |
| Interquartile 75% (IQ3) | 4.6% | 2.3% |
| Interquartile Range (IQR) | 1.8% | 0.53% |
| Standard Deviation (Sample) | 2.1% | 0.71% |
| Standard Deviation (Population) | 2.1% | 0.70% |
Similar Demographics by Vision Disability
Demographics Similar to Cajuns by Vision Disability
In terms of vision disability, the demographic groups most similar to Cajuns are Seminole (3.1%, a difference of 0.010%), Central American Indian (3.0%, a difference of 0.45%), Colville (3.0%, a difference of 1.1%), Cheyenne (3.1%, a difference of 1.1%), and Apache (3.0%, a difference of 2.3%).
| Demographics | Rating | Rank | Vision Disability |
| Spanish Americans | 0.0 /100 | #326 | Tragic 2.9% |
| Natives/Alaskans | 0.0 /100 | #327 | Tragic 3.0% |
| Yuman | 0.0 /100 | #328 | Tragic 3.0% |
| Apache | 0.0 /100 | #329 | Tragic 3.0% |
| Colville | 0.0 /100 | #330 | Tragic 3.0% |
| Central American Indians | 0.0 /100 | #331 | Tragic 3.0% |
| Seminole | 0.0 /100 | #332 | Tragic 3.1% |
| Cajuns | 0.0 /100 | #333 | Tragic 3.1% |
| Cheyenne | 0.0 /100 | #334 | Tragic 3.1% |
| Navajo | 0.0 /100 | #335 | Tragic 3.1% |
| Alaskan Athabascans | 0.0 /100 | #336 | Tragic 3.1% |
| Dutch West Indians | 0.0 /100 | #337 | Tragic 3.2% |
| Chickasaw | 0.0 /100 | #338 | Tragic 3.2% |
| Tsimshian | 0.0 /100 | #339 | Tragic 3.2% |
| Creek | 0.0 /100 | #340 | Tragic 3.2% |
Demographics Similar to Immigrants from Moldova by Vision Disability
In terms of vision disability, the demographic groups most similar to Immigrants from Moldova are Chinese (2.0%, a difference of 0.020%), Immigrants from Switzerland (2.0%, a difference of 0.060%), Norwegian (2.0%, a difference of 0.070%), Immigrants from Latvia (2.0%, a difference of 0.080%), and Immigrants from Eastern Africa (2.0%, a difference of 0.11%).
| Demographics | Rating | Rank | Vision Disability |
| Assyrians/Chaldeans/Syriacs | 98.1 /100 | #79 | Exceptional 2.0% |
| Lithuanians | 97.7 /100 | #80 | Exceptional 2.0% |
| Soviet Union | 97.6 /100 | #81 | Exceptional 2.0% |
| Immigrants | Poland | 97.6 /100 | #82 | Exceptional 2.0% |
| Immigrants | Western Asia | 97.5 /100 | #83 | Exceptional 2.0% |
| Immigrants | Latvia | 97.3 /100 | #84 | Exceptional 2.0% |
| Chinese | 97.2 /100 | #85 | Exceptional 2.0% |
| Immigrants | Moldova | 97.2 /100 | #86 | Exceptional 2.0% |
| Immigrants | Switzerland | 97.0 /100 | #87 | Exceptional 2.0% |
| Norwegians | 97.0 /100 | #88 | Exceptional 2.0% |
| Immigrants | Eastern Africa | 97.0 /100 | #89 | Exceptional 2.0% |
| Immigrants | Lebanon | 96.7 /100 | #90 | Exceptional 2.1% |
| Immigrants | Somalia | 96.2 /100 | #91 | Exceptional 2.1% |
| Immigrants | Syria | 96.2 /100 | #92 | Exceptional 2.1% |
| Immigrants | Europe | 96.1 /100 | #93 | Exceptional 2.1% |