British vs Immigrants from Portugal 7th Grade
COMPARE
British
Immigrants from Portugal
7th Grade
7th Grade Comparison
British
Immigrants from Portugal
97.2%
7TH GRADE
100.0/ 100
METRIC RATING
37th/ 347
METRIC RANK
94.2%
7TH GRADE
0.0/ 100
METRIC RATING
307th/ 347
METRIC RANK
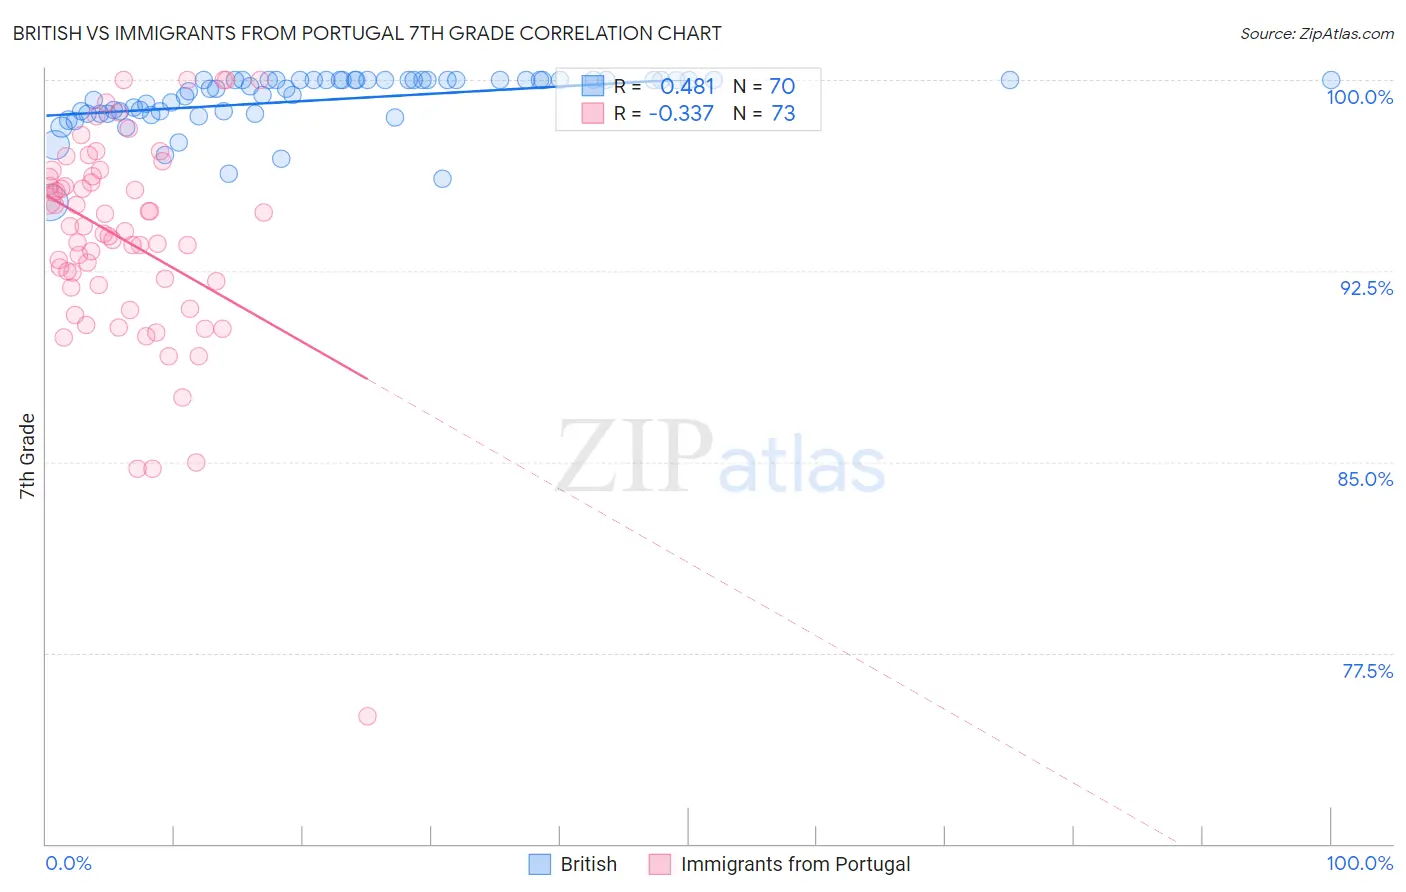
British vs Immigrants from Portugal 7th Grade Correlation Chart
The statistical analysis conducted on geographies consisting of 531,462,837 people shows a moderate positive correlation between the proportion of British and percentage of population with at least 7th grade education in the United States with a correlation coefficient (R) of 0.481 and weighted average of 97.2%. Similarly, the statistical analysis conducted on geographies consisting of 174,792,107 people shows a mild negative correlation between the proportion of Immigrants from Portugal and percentage of population with at least 7th grade education in the United States with a correlation coefficient (R) of -0.337 and weighted average of 94.2%, a difference of 3.2%.
7th Grade Correlation Summary
| Measurement | British | Immigrants from Portugal |
| Minimum | 95.2% | 75.0% |
| Maximum | 100.0% | 100.0% |
| Range | 4.8% | 25.0% |
| Mean | 99.2% | 93.7% |
| Median | 99.7% | 94.1% |
| Interquartile 25% (IQ1) | 98.7% | 91.9% |
| Interquartile 75% (IQ3) | 100.0% | 96.2% |
| Interquartile Range (IQR) | 1.3% | 4.3% |
| Standard Deviation (Sample) | 1.1% | 4.1% |
| Standard Deviation (Population) | 1.1% | 4.1% |
Similar Demographics by 7th Grade
Demographics Similar to British by 7th Grade
In terms of 7th grade, the demographic groups most similar to British are Hungarian (97.2%, a difference of 0.010%), Belgian (97.2%, a difference of 0.010%), Latvian (97.2%, a difference of 0.020%), Luxembourger (97.2%, a difference of 0.020%), and Eastern European (97.2%, a difference of 0.040%).
| Demographics | Rating | Rank | 7th Grade |
| Czechs | 100.0 /100 | #30 | Exceptional 97.4% |
| Europeans | 100.0 /100 | #31 | Exceptional 97.3% |
| Italians | 100.0 /100 | #32 | Exceptional 97.3% |
| Chippewa | 100.0 /100 | #33 | Exceptional 97.3% |
| Alaska Natives | 100.0 /100 | #34 | Exceptional 97.3% |
| Swiss | 100.0 /100 | #35 | Exceptional 97.3% |
| Hungarians | 100.0 /100 | #36 | Exceptional 97.2% |
| British | 100.0 /100 | #37 | Exceptional 97.2% |
| Belgians | 100.0 /100 | #38 | Exceptional 97.2% |
| Latvians | 100.0 /100 | #39 | Exceptional 97.2% |
| Luxembourgers | 100.0 /100 | #40 | Exceptional 97.2% |
| Eastern Europeans | 100.0 /100 | #41 | Exceptional 97.2% |
| Chinese | 99.9 /100 | #42 | Exceptional 97.1% |
| Maltese | 99.9 /100 | #43 | Exceptional 97.1% |
| Northern Europeans | 99.9 /100 | #44 | Exceptional 97.1% |
Demographics Similar to Immigrants from Portugal by 7th Grade
In terms of 7th grade, the demographic groups most similar to Immigrants from Portugal are Immigrants from Guyana (94.2%, a difference of 0.020%), Cape Verdean (94.1%, a difference of 0.080%), Ecuadorian (94.0%, a difference of 0.14%), Guyanese (94.3%, a difference of 0.15%), and Immigrants from Caribbean (94.0%, a difference of 0.15%).
| Demographics | Rating | Rank | 7th Grade |
| Immigrants | Burma/Myanmar | 0.0 /100 | #300 | Tragic 94.5% |
| Immigrants | Dominica | 0.0 /100 | #301 | Tragic 94.5% |
| Immigrants | Laos | 0.0 /100 | #302 | Tragic 94.5% |
| Sri Lankans | 0.0 /100 | #303 | Tragic 94.4% |
| Immigrants | Haiti | 0.0 /100 | #304 | Tragic 94.3% |
| Guyanese | 0.0 /100 | #305 | Tragic 94.3% |
| Immigrants | Guyana | 0.0 /100 | #306 | Tragic 94.2% |
| Immigrants | Portugal | 0.0 /100 | #307 | Tragic 94.2% |
| Cape Verdeans | 0.0 /100 | #308 | Tragic 94.1% |
| Ecuadorians | 0.0 /100 | #309 | Tragic 94.0% |
| Immigrants | Caribbean | 0.0 /100 | #310 | Tragic 94.0% |
| Puerto Ricans | 0.0 /100 | #311 | Tragic 94.0% |
| Immigrants | Immigrants | 0.0 /100 | #312 | Tragic 94.0% |
| Immigrants | Bangladesh | 0.0 /100 | #313 | Tragic 94.0% |
| Japanese | 0.0 /100 | #314 | Tragic 94.0% |