Sioux vs Immigrants from Portugal 3 or more Vehicles in Household
COMPARE
Sioux
Immigrants from Portugal
3 or more Vehicles in Household
3 or more Vehicles in Household Comparison
Sioux
Immigrants from Portugal
22.6%
3 OR MORE VEHICLES IN HOUSEHOLD
100.0/ 100
METRIC RATING
50th/ 347
METRIC RANK
18.6%
3 OR MORE VEHICLES IN HOUSEHOLD
8.9/ 100
METRIC RATING
218th/ 347
METRIC RANK
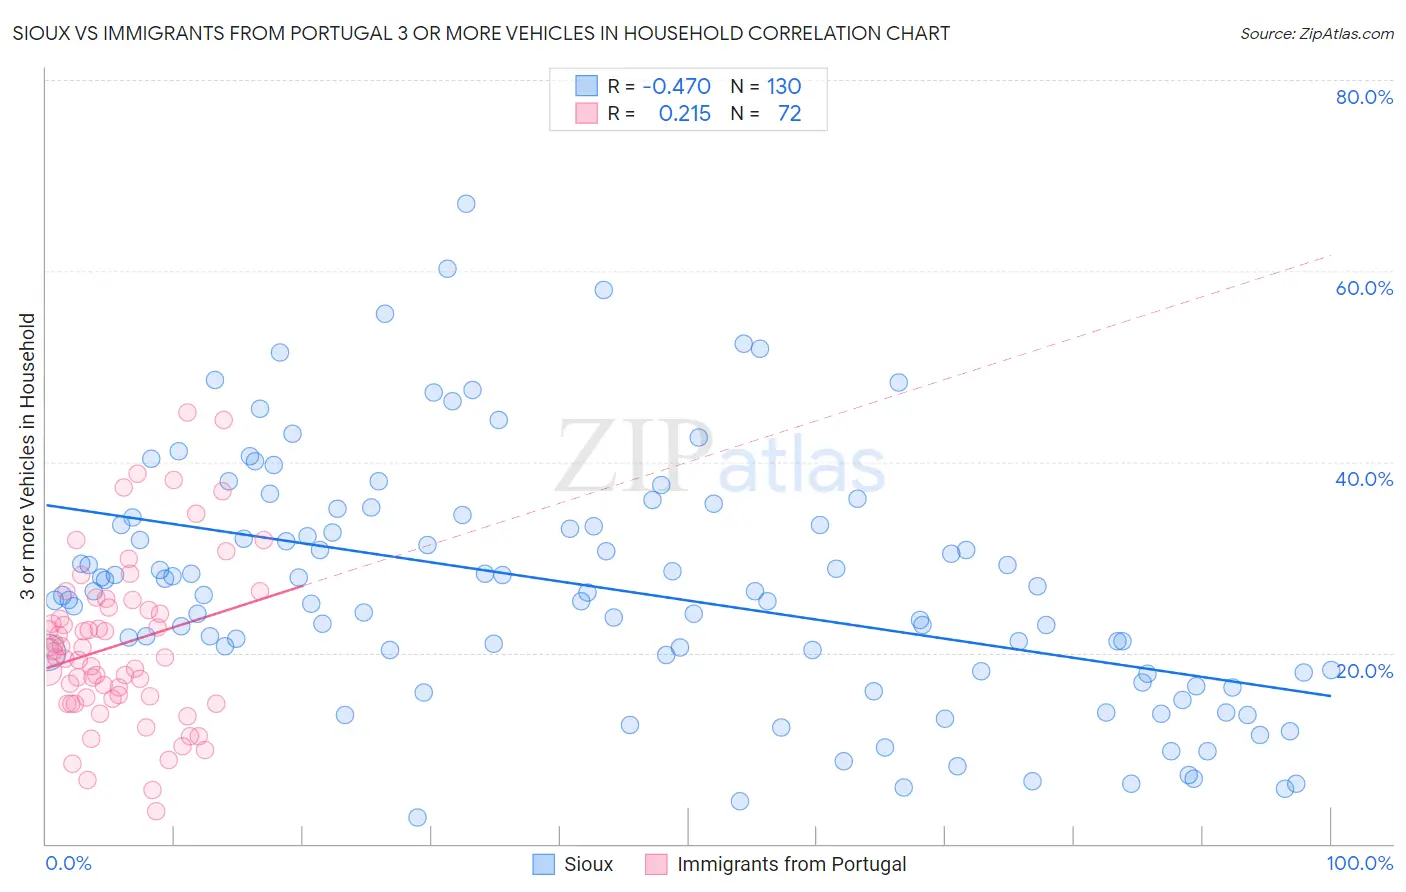
Sioux vs Immigrants from Portugal 3 or more Vehicles in Household Correlation Chart
The statistical analysis conducted on geographies consisting of 234,089,228 people shows a moderate negative correlation between the proportion of Sioux and percentage of households with 3 or more vehicles available in the United States with a correlation coefficient (R) of -0.470 and weighted average of 22.6%. Similarly, the statistical analysis conducted on geographies consisting of 174,744,003 people shows a weak positive correlation between the proportion of Immigrants from Portugal and percentage of households with 3 or more vehicles available in the United States with a correlation coefficient (R) of 0.215 and weighted average of 18.6%, a difference of 21.1%.
3 or more Vehicles in Household Correlation Summary
| Measurement | Sioux | Immigrants from Portugal |
| Minimum | 2.8% | 3.4% |
| Maximum | 67.1% | 45.2% |
| Range | 64.3% | 41.7% |
| Mean | 26.9% | 20.9% |
| Median | 26.2% | 19.9% |
| Interquartile 25% (IQ1) | 18.1% | 15.2% |
| Interquartile 75% (IQ3) | 33.5% | 25.1% |
| Interquartile Range (IQR) | 15.3% | 9.9% |
| Standard Deviation (Sample) | 12.8% | 8.7% |
| Standard Deviation (Population) | 12.8% | 8.6% |
Similar Demographics by 3 or more Vehicles in Household
Demographics Similar to Sioux by 3 or more Vehicles in Household
In terms of 3 or more vehicles in household, the demographic groups most similar to Sioux are White/Caucasian (22.6%, a difference of 0.010%), Welsh (22.6%, a difference of 0.050%), Scotch-Irish (22.6%, a difference of 0.060%), Scottish (22.6%, a difference of 0.16%), and Malaysian (22.6%, a difference of 0.17%).
| Demographics | Rating | Rank | 3 or more Vehicles in Household |
| Osage | 100.0 /100 | #43 | Exceptional 22.7% |
| Cheyenne | 100.0 /100 | #44 | Exceptional 22.7% |
| Ute | 100.0 /100 | #45 | Exceptional 22.7% |
| Americans | 100.0 /100 | #46 | Exceptional 22.6% |
| Malaysians | 100.0 /100 | #47 | Exceptional 22.6% |
| Scottish | 100.0 /100 | #48 | Exceptional 22.6% |
| Scotch-Irish | 100.0 /100 | #49 | Exceptional 22.6% |
| Sioux | 100.0 /100 | #50 | Exceptional 22.6% |
| Whites/Caucasians | 100.0 /100 | #51 | Exceptional 22.6% |
| Welsh | 100.0 /100 | #52 | Exceptional 22.6% |
| Czechs | 100.0 /100 | #53 | Exceptional 22.5% |
| Crow | 100.0 /100 | #54 | Exceptional 22.5% |
| Immigrants | Laos | 100.0 /100 | #55 | Exceptional 22.4% |
| Hispanics or Latinos | 100.0 /100 | #56 | Exceptional 22.4% |
| Pennsylvania Germans | 100.0 /100 | #57 | Exceptional 22.3% |
Demographics Similar to Immigrants from Portugal by 3 or more Vehicles in Household
In terms of 3 or more vehicles in household, the demographic groups most similar to Immigrants from Portugal are Immigrants from Armenia (18.6%, a difference of 0.080%), Nigerian (18.6%, a difference of 0.28%), Immigrants from Italy (18.7%, a difference of 0.29%), Immigrants from Nigeria (18.7%, a difference of 0.31%), and Eastern European (18.7%, a difference of 0.37%).
| Demographics | Rating | Rank | 3 or more Vehicles in Household |
| Immigrants | Kenya | 12.4 /100 | #211 | Poor 18.8% |
| Panamanians | 11.6 /100 | #212 | Poor 18.8% |
| Immigrants | Cuba | 11.6 /100 | #213 | Poor 18.8% |
| Immigrants | Sierra Leone | 10.8 /100 | #214 | Poor 18.7% |
| Eastern Europeans | 10.6 /100 | #215 | Poor 18.7% |
| Immigrants | Nigeria | 10.3 /100 | #216 | Poor 18.7% |
| Immigrants | Italy | 10.2 /100 | #217 | Poor 18.7% |
| Immigrants | Portugal | 8.9 /100 | #218 | Tragic 18.6% |
| Immigrants | Armenia | 8.6 /100 | #219 | Tragic 18.6% |
| Nigerians | 7.9 /100 | #220 | Tragic 18.6% |
| Immigrants | Poland | 7.5 /100 | #221 | Tragic 18.6% |
| Belizeans | 7.3 /100 | #222 | Tragic 18.6% |
| Immigrants | Czechoslovakia | 5.9 /100 | #223 | Tragic 18.5% |
| Immigrants | Argentina | 5.6 /100 | #224 | Tragic 18.5% |
| Immigrants | Lithuania | 5.6 /100 | #225 | Tragic 18.5% |