Immigrants from Cambodia vs Hawaiian 3 or more Vehicles in Household
COMPARE
Immigrants from Cambodia
Hawaiian
3 or more Vehicles in Household
3 or more Vehicles in Household Comparison
Immigrants from Cambodia
Hawaiians
21.1%
3 OR MORE VEHICLES IN HOUSEHOLD
98.6/ 100
METRIC RATING
94th/ 347
METRIC RANK
24.3%
3 OR MORE VEHICLES IN HOUSEHOLD
100.0/ 100
METRIC RATING
15th/ 347
METRIC RANK
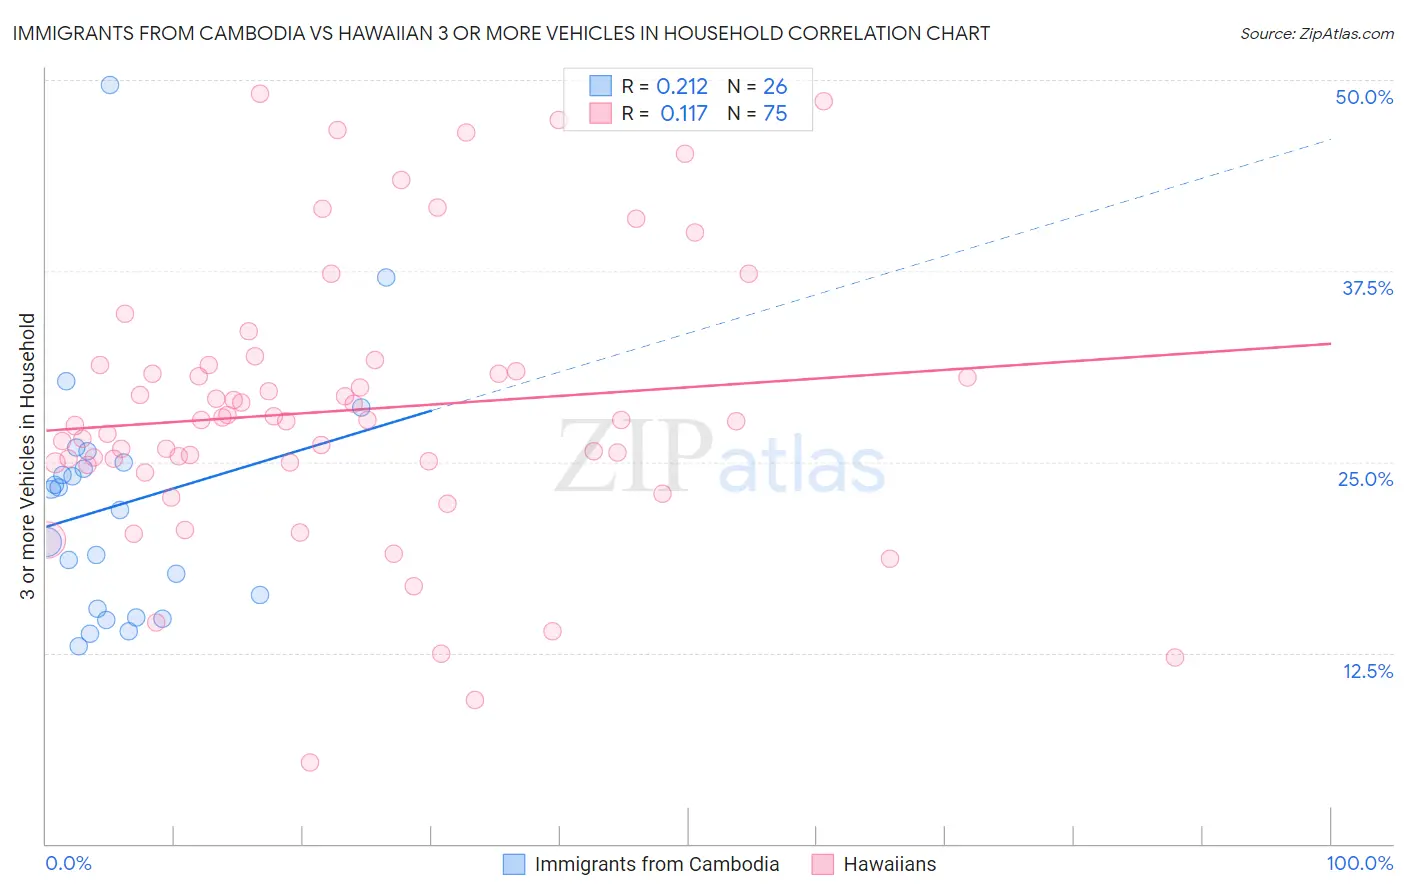
Immigrants from Cambodia vs Hawaiian 3 or more Vehicles in Household Correlation Chart
The statistical analysis conducted on geographies consisting of 205,124,978 people shows a weak positive correlation between the proportion of Immigrants from Cambodia and percentage of households with 3 or more vehicles available in the United States with a correlation coefficient (R) of 0.212 and weighted average of 21.1%. Similarly, the statistical analysis conducted on geographies consisting of 327,356,471 people shows a poor positive correlation between the proportion of Hawaiians and percentage of households with 3 or more vehicles available in the United States with a correlation coefficient (R) of 0.117 and weighted average of 24.3%, a difference of 15.2%.
3 or more Vehicles in Household Correlation Summary
| Measurement | Immigrants from Cambodia | Hawaiian |
| Minimum | 13.0% | 5.3% |
| Maximum | 49.7% | 49.1% |
| Range | 36.7% | 43.8% |
| Mean | 22.2% | 28.4% |
| Median | 22.5% | 27.7% |
| Interquartile 25% (IQ1) | 15.4% | 24.9% |
| Interquartile 75% (IQ3) | 25.0% | 31.3% |
| Interquartile Range (IQR) | 9.6% | 6.4% |
| Standard Deviation (Sample) | 8.1% | 9.0% |
| Standard Deviation (Population) | 8.0% | 8.9% |
Similar Demographics by 3 or more Vehicles in Household
Demographics Similar to Immigrants from Cambodia by 3 or more Vehicles in Household
In terms of 3 or more vehicles in household, the demographic groups most similar to Immigrants from Cambodia are Pakistani (21.0%, a difference of 0.14%), Immigrants from Indonesia (21.1%, a difference of 0.23%), Cree (21.0%, a difference of 0.23%), Canadian (21.0%, a difference of 0.34%), and Hmong (21.0%, a difference of 0.40%).
| Demographics | Rating | Rank | 3 or more Vehicles in Household |
| Immigrants | Azores | 99.5 /100 | #87 | Exceptional 21.5% |
| French | 99.4 /100 | #88 | Exceptional 21.4% |
| Marshallese | 99.2 /100 | #89 | Exceptional 21.3% |
| Immigrants | Afghanistan | 99.1 /100 | #90 | Exceptional 21.2% |
| Belgians | 98.9 /100 | #91 | Exceptional 21.2% |
| Apache | 98.9 /100 | #92 | Exceptional 21.2% |
| Immigrants | Indonesia | 98.8 /100 | #93 | Exceptional 21.1% |
| Immigrants | Cambodia | 98.6 /100 | #94 | Exceptional 21.1% |
| Pakistanis | 98.5 /100 | #95 | Exceptional 21.0% |
| Cree | 98.4 /100 | #96 | Exceptional 21.0% |
| Canadians | 98.3 /100 | #97 | Exceptional 21.0% |
| Hmong | 98.2 /100 | #98 | Exceptional 21.0% |
| Alaska Natives | 98.2 /100 | #99 | Exceptional 21.0% |
| Comanche | 98.2 /100 | #100 | Exceptional 21.0% |
| Blackfeet | 97.9 /100 | #101 | Exceptional 20.9% |
Demographics Similar to Hawaiians by 3 or more Vehicles in Household
In terms of 3 or more vehicles in household, the demographic groups most similar to Hawaiians are Basque (24.3%, a difference of 0.030%), Korean (24.1%, a difference of 0.83%), Immigrants from Mexico (24.6%, a difference of 1.4%), Norwegian (23.9%, a difference of 1.6%), and Chinese (23.9%, a difference of 1.7%).
| Demographics | Rating | Rank | 3 or more Vehicles in Household |
| Samoans | 100.0 /100 | #8 | Exceptional 25.0% |
| Native Hawaiians | 100.0 /100 | #9 | Exceptional 24.9% |
| Nepalese | 100.0 /100 | #10 | Exceptional 24.9% |
| Shoshone | 100.0 /100 | #11 | Exceptional 24.9% |
| Danes | 100.0 /100 | #12 | Exceptional 24.7% |
| Mexicans | 100.0 /100 | #13 | Exceptional 24.7% |
| Immigrants | Mexico | 100.0 /100 | #14 | Exceptional 24.6% |
| Hawaiians | 100.0 /100 | #15 | Exceptional 24.3% |
| Basques | 100.0 /100 | #16 | Exceptional 24.3% |
| Koreans | 100.0 /100 | #17 | Exceptional 24.1% |
| Norwegians | 100.0 /100 | #18 | Exceptional 23.9% |
| Chinese | 100.0 /100 | #19 | Exceptional 23.9% |
| Paiute | 100.0 /100 | #20 | Exceptional 23.8% |
| Immigrants | Vietnam | 100.0 /100 | #21 | Exceptional 23.8% |
| Immigrants | Philippines | 100.0 /100 | #22 | Exceptional 23.8% |