British vs Hawaiian Female Poverty Among 25-34 Year Olds
COMPARE
British
Hawaiian
Female Poverty Among 25-34 Year Olds
Female Poverty Among 25-34 Year Olds Comparison
British
Hawaiians
13.4%
FEMALE POVERTY AMONG 25-34 YEAR OLDS
63.5/ 100
METRIC RATING
163rd/ 347
METRIC RANK
14.1%
FEMALE POVERTY AMONG 25-34 YEAR OLDS
13.6/ 100
METRIC RATING
204th/ 347
METRIC RANK
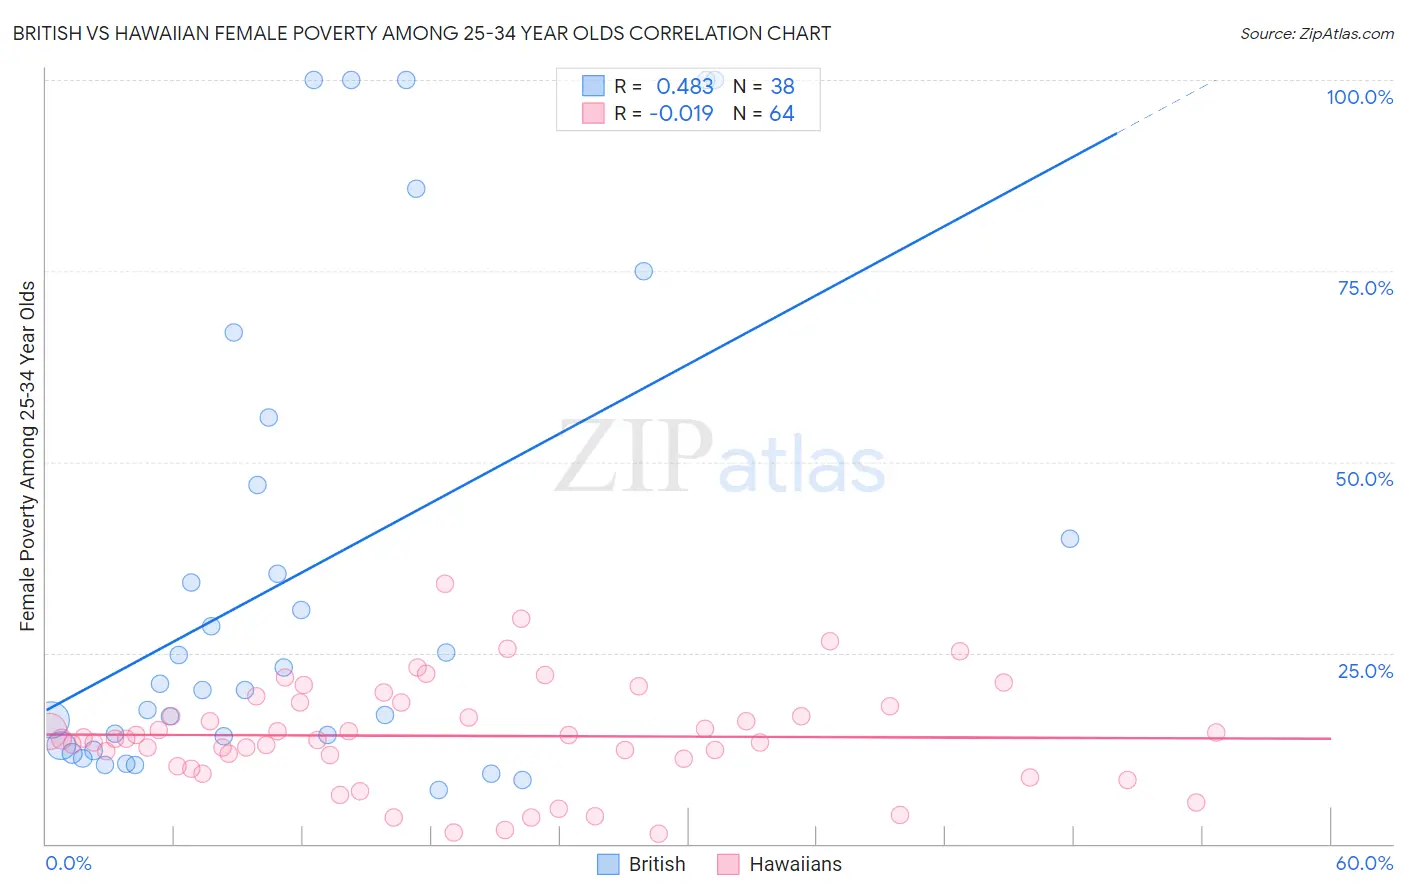
British vs Hawaiian Female Poverty Among 25-34 Year Olds Correlation Chart
The statistical analysis conducted on geographies consisting of 515,268,624 people shows a moderate positive correlation between the proportion of British and poverty level among females between the ages 25 and 34 in the United States with a correlation coefficient (R) of 0.483 and weighted average of 13.4%. Similarly, the statistical analysis conducted on geographies consisting of 324,442,153 people shows no correlation between the proportion of Hawaiians and poverty level among females between the ages 25 and 34 in the United States with a correlation coefficient (R) of -0.019 and weighted average of 14.1%, a difference of 5.0%.
Female Poverty Among 25-34 Year Olds Correlation Summary
| Measurement | British | Hawaiian |
| Minimum | 7.0% | 1.2% |
| Maximum | 100.0% | 34.1% |
| Range | 93.0% | 32.8% |
| Mean | 35.4% | 14.1% |
| Median | 20.6% | 13.8% |
| Interquartile 25% (IQ1) | 12.8% | 10.7% |
| Interquartile 75% (IQ3) | 46.9% | 18.2% |
| Interquartile Range (IQR) | 34.1% | 7.5% |
| Standard Deviation (Sample) | 31.5% | 6.8% |
| Standard Deviation (Population) | 31.1% | 6.8% |
Similar Demographics by Female Poverty Among 25-34 Year Olds
Demographics Similar to British by Female Poverty Among 25-34 Year Olds
In terms of female poverty among 25-34 year olds, the demographic groups most similar to British are Ugandan (13.4%, a difference of 0.050%), Swiss (13.4%, a difference of 0.16%), Icelander (13.3%, a difference of 0.20%), Immigrants from South America (13.3%, a difference of 0.26%), and Uruguayan (13.3%, a difference of 0.32%).
| Demographics | Rating | Rank | Female Poverty Among 25-34 Year Olds |
| Immigrants | Cameroon | 72.0 /100 | #156 | Good 13.3% |
| Immigrants | Western Europe | 70.3 /100 | #157 | Good 13.3% |
| Immigrants | Colombia | 69.2 /100 | #158 | Good 13.3% |
| Uruguayans | 66.9 /100 | #159 | Good 13.3% |
| Immigrants | South America | 66.3 /100 | #160 | Good 13.3% |
| Icelanders | 65.7 /100 | #161 | Good 13.3% |
| Ugandans | 64.1 /100 | #162 | Good 13.4% |
| British | 63.5 /100 | #163 | Good 13.4% |
| Swiss | 61.7 /100 | #164 | Good 13.4% |
| Basques | 59.3 /100 | #165 | Average 13.4% |
| Belgians | 58.9 /100 | #166 | Average 13.4% |
| Immigrants | Bosnia and Herzegovina | 58.6 /100 | #167 | Average 13.4% |
| Immigrants | Afghanistan | 57.7 /100 | #168 | Average 13.4% |
| Samoans | 56.8 /100 | #169 | Average 13.5% |
| Immigrants | Uganda | 53.0 /100 | #170 | Average 13.5% |
Demographics Similar to Hawaiians by Female Poverty Among 25-34 Year Olds
In terms of female poverty among 25-34 year olds, the demographic groups most similar to Hawaiians are Immigrants from Africa (14.1%, a difference of 0.050%), Immigrants (14.0%, a difference of 0.15%), Hungarian (14.1%, a difference of 0.33%), Japanese (14.1%, a difference of 0.35%), and Immigrants from Panama (14.1%, a difference of 0.37%).
| Demographics | Rating | Rank | Female Poverty Among 25-34 Year Olds |
| Immigrants | Saudi Arabia | 21.9 /100 | #197 | Fair 13.9% |
| Immigrants | Germany | 20.9 /100 | #198 | Fair 13.9% |
| English | 20.4 /100 | #199 | Fair 13.9% |
| Hmong | 20.3 /100 | #200 | Fair 13.9% |
| Immigrants | Trinidad and Tobago | 17.6 /100 | #201 | Poor 14.0% |
| Welsh | 17.2 /100 | #202 | Poor 14.0% |
| Immigrants | Immigrants | 14.5 /100 | #203 | Poor 14.0% |
| Hawaiians | 13.6 /100 | #204 | Poor 14.1% |
| Immigrants | Africa | 13.4 /100 | #205 | Poor 14.1% |
| Hungarians | 11.8 /100 | #206 | Poor 14.1% |
| Japanese | 11.7 /100 | #207 | Poor 14.1% |
| Immigrants | Panama | 11.6 /100 | #208 | Poor 14.1% |
| Guyanese | 8.6 /100 | #209 | Tragic 14.2% |
| Panamanians | 8.6 /100 | #210 | Tragic 14.2% |
| Trinidadians and Tobagonians | 8.2 /100 | #211 | Tragic 14.2% |