Uruguayan vs Immigrants from France 3 or more Vehicles in Household
COMPARE
Uruguayan
Immigrants from France
3 or more Vehicles in Household
3 or more Vehicles in Household Comparison
Uruguayans
Immigrants from France
17.8%
3 OR MORE VEHICLES IN HOUSEHOLD
1.0/ 100
METRIC RATING
259th/ 347
METRIC RANK
17.6%
3 OR MORE VEHICLES IN HOUSEHOLD
0.6/ 100
METRIC RATING
269th/ 347
METRIC RANK
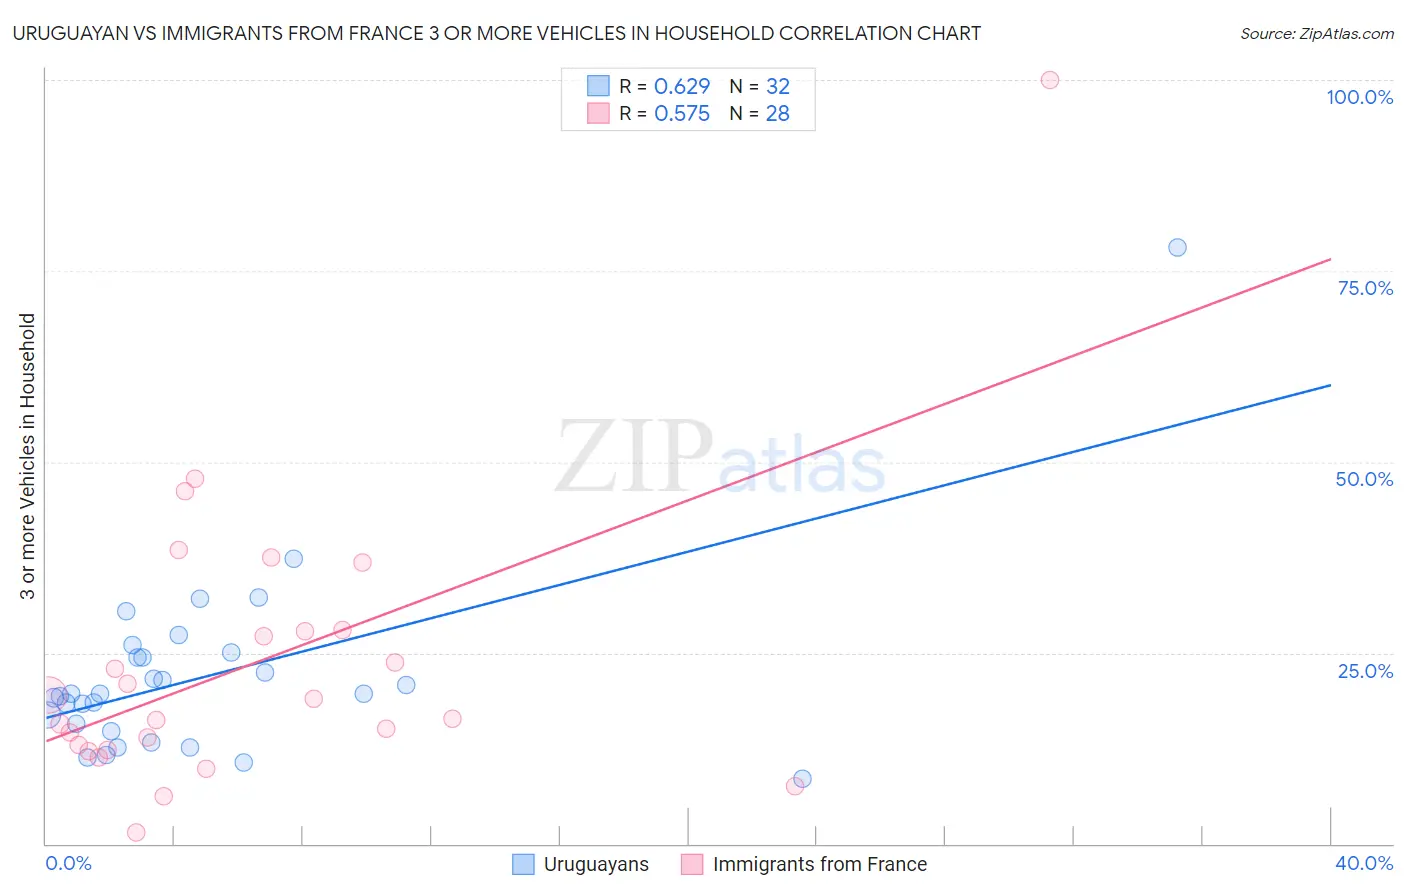
Uruguayan vs Immigrants from France 3 or more Vehicles in Household Correlation Chart
The statistical analysis conducted on geographies consisting of 144,743,847 people shows a significant positive correlation between the proportion of Uruguayans and percentage of households with 3 or more vehicles available in the United States with a correlation coefficient (R) of 0.629 and weighted average of 17.8%. Similarly, the statistical analysis conducted on geographies consisting of 287,763,737 people shows a substantial positive correlation between the proportion of Immigrants from France and percentage of households with 3 or more vehicles available in the United States with a correlation coefficient (R) of 0.575 and weighted average of 17.6%, a difference of 0.97%.
3 or more Vehicles in Household Correlation Summary
| Measurement | Uruguayan | Immigrants from France |
| Minimum | 8.6% | 1.5% |
| Maximum | 78.0% | 100.0% |
| Range | 69.5% | 98.5% |
| Mean | 22.0% | 23.6% |
| Median | 19.7% | 17.7% |
| Interquartile 25% (IQ1) | 15.3% | 12.6% |
| Interquartile 75% (IQ3) | 24.7% | 27.9% |
| Interquartile Range (IQR) | 9.4% | 15.4% |
| Standard Deviation (Sample) | 12.3% | 19.1% |
| Standard Deviation (Population) | 12.1% | 18.7% |
Demographics Similar to Uruguayans and Immigrants from France by 3 or more Vehicles in Household
In terms of 3 or more vehicles in household, the demographic groups most similar to Uruguayans are Ugandan (17.8%, a difference of 0.13%), Immigrants from Northern Africa (17.8%, a difference of 0.15%), Colombian (17.8%, a difference of 0.18%), Immigrants from Eritrea (17.8%, a difference of 0.22%), and Sudanese (17.8%, a difference of 0.22%). Similarly, the demographic groups most similar to Immigrants from France are Immigrants from Nepal (17.6%, a difference of 0.050%), South American (17.6%, a difference of 0.050%), Immigrants from Bulgaria (17.7%, a difference of 0.42%), Immigrants from Venezuela (17.7%, a difference of 0.44%), and Immigrants from Africa (17.6%, a difference of 0.46%).
| Demographics | Rating | Rank | 3 or more Vehicles in Household |
| Ethiopians | 1.2 /100 | #254 | Tragic 17.9% |
| Immigrants | Turkey | 1.2 /100 | #255 | Tragic 17.9% |
| Sub-Saharan Africans | 1.1 /100 | #256 | Tragic 17.9% |
| Immigrants | Eritrea | 1.1 /100 | #257 | Tragic 17.8% |
| Sudanese | 1.1 /100 | #258 | Tragic 17.8% |
| Uruguayans | 1.0 /100 | #259 | Tragic 17.8% |
| Ugandans | 0.9 /100 | #260 | Tragic 17.8% |
| Immigrants | Northern Africa | 0.9 /100 | #261 | Tragic 17.8% |
| Colombians | 0.9 /100 | #262 | Tragic 17.8% |
| Bermudans | 0.9 /100 | #263 | Tragic 17.8% |
| Cambodians | 0.9 /100 | #264 | Tragic 17.8% |
| Immigrants | Panama | 0.8 /100 | #265 | Tragic 17.7% |
| Macedonians | 0.8 /100 | #266 | Tragic 17.7% |
| Immigrants | Venezuela | 0.8 /100 | #267 | Tragic 17.7% |
| Immigrants | Bulgaria | 0.8 /100 | #268 | Tragic 17.7% |
| Immigrants | France | 0.6 /100 | #269 | Tragic 17.6% |
| Immigrants | Nepal | 0.6 /100 | #270 | Tragic 17.6% |
| South Americans | 0.6 /100 | #271 | Tragic 17.6% |
| Immigrants | Africa | 0.5 /100 | #272 | Tragic 17.6% |
| Immigrants | Sudan | 0.5 /100 | #273 | Tragic 17.6% |
| Immigrants | Bosnia and Herzegovina | 0.5 /100 | #274 | Tragic 17.5% |