Belgian vs British 3 or more Vehicles in Household
COMPARE
Belgian
British
3 or more Vehicles in Household
3 or more Vehicles in Household Comparison
Belgians
British
21.2%
3 OR MORE VEHICLES IN HOUSEHOLD
98.9/ 100
METRIC RATING
91st/ 347
METRIC RANK
21.9%
3 OR MORE VEHICLES IN HOUSEHOLD
99.9/ 100
METRIC RATING
68th/ 347
METRIC RANK
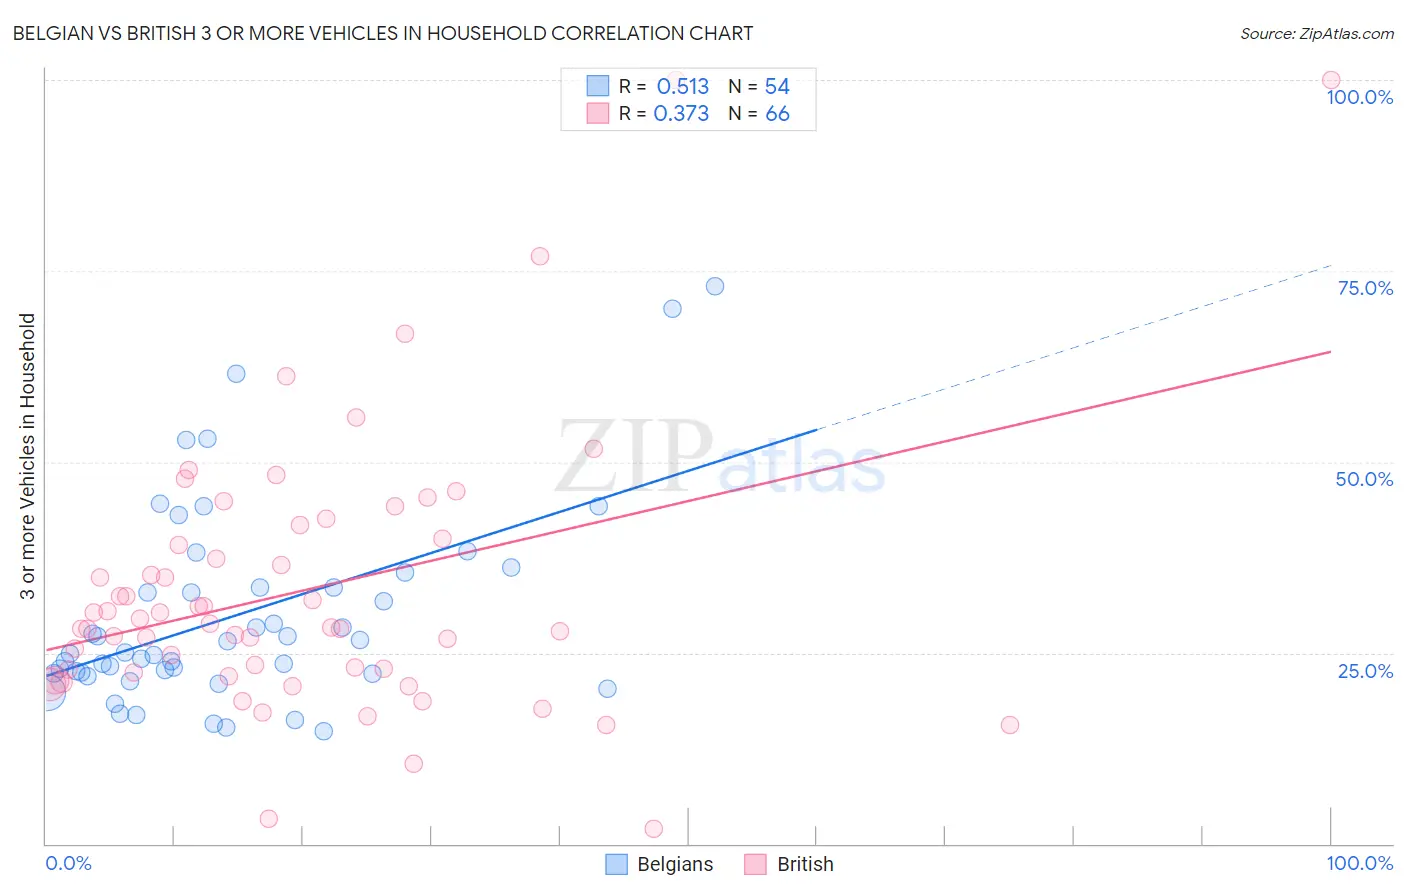
Belgian vs British 3 or more Vehicles in Household Correlation Chart
The statistical analysis conducted on geographies consisting of 355,741,877 people shows a substantial positive correlation between the proportion of Belgians and percentage of households with 3 or more vehicles available in the United States with a correlation coefficient (R) of 0.513 and weighted average of 21.2%. Similarly, the statistical analysis conducted on geographies consisting of 530,803,931 people shows a mild positive correlation between the proportion of British and percentage of households with 3 or more vehicles available in the United States with a correlation coefficient (R) of 0.373 and weighted average of 21.9%, a difference of 3.5%.
3 or more Vehicles in Household Correlation Summary
| Measurement | Belgian | British |
| Minimum | 14.7% | 1.9% |
| Maximum | 73.1% | 100.0% |
| Range | 58.4% | 98.1% |
| Mean | 29.9% | 33.2% |
| Median | 25.0% | 28.6% |
| Interquartile 25% (IQ1) | 22.3% | 22.5% |
| Interquartile 75% (IQ3) | 33.6% | 40.0% |
| Interquartile Range (IQR) | 11.3% | 17.5% |
| Standard Deviation (Sample) | 13.1% | 18.1% |
| Standard Deviation (Population) | 12.9% | 18.0% |
Similar Demographics by 3 or more Vehicles in Household
Demographics Similar to Belgians by 3 or more Vehicles in Household
In terms of 3 or more vehicles in household, the demographic groups most similar to Belgians are Apache (21.2%, a difference of 0.080%), Immigrants from Indonesia (21.1%, a difference of 0.28%), Immigrants from Afghanistan (21.2%, a difference of 0.33%), Immigrants from Cambodia (21.1%, a difference of 0.51%), and Marshallese (21.3%, a difference of 0.55%).
| Demographics | Rating | Rank | 3 or more Vehicles in Household |
| Icelanders | 99.6 /100 | #84 | Exceptional 21.5% |
| Laotians | 99.6 /100 | #85 | Exceptional 21.5% |
| Delaware | 99.6 /100 | #86 | Exceptional 21.5% |
| Immigrants | Azores | 99.5 /100 | #87 | Exceptional 21.5% |
| French | 99.4 /100 | #88 | Exceptional 21.4% |
| Marshallese | 99.2 /100 | #89 | Exceptional 21.3% |
| Immigrants | Afghanistan | 99.1 /100 | #90 | Exceptional 21.2% |
| Belgians | 98.9 /100 | #91 | Exceptional 21.2% |
| Apache | 98.9 /100 | #92 | Exceptional 21.2% |
| Immigrants | Indonesia | 98.8 /100 | #93 | Exceptional 21.1% |
| Immigrants | Cambodia | 98.6 /100 | #94 | Exceptional 21.1% |
| Pakistanis | 98.5 /100 | #95 | Exceptional 21.0% |
| Cree | 98.4 /100 | #96 | Exceptional 21.0% |
| Canadians | 98.3 /100 | #97 | Exceptional 21.0% |
| Hmong | 98.2 /100 | #98 | Exceptional 21.0% |
Demographics Similar to British by 3 or more Vehicles in Household
In terms of 3 or more vehicles in household, the demographic groups most similar to British are Creek (21.9%, a difference of 0.030%), Alaskan Athabascan (21.9%, a difference of 0.15%), Bangladeshi (21.9%, a difference of 0.22%), Potawatomi (21.9%, a difference of 0.23%), and Northern European (22.0%, a difference of 0.41%).
| Demographics | Rating | Rank | 3 or more Vehicles in Household |
| Bhutanese | 99.9 /100 | #61 | Exceptional 22.2% |
| Fijians | 99.9 /100 | #62 | Exceptional 22.2% |
| Chickasaw | 99.9 /100 | #63 | Exceptional 22.2% |
| Immigrants | Taiwan | 99.9 /100 | #64 | Exceptional 22.1% |
| Pima | 99.9 /100 | #65 | Exceptional 22.0% |
| Northern Europeans | 99.9 /100 | #66 | Exceptional 22.0% |
| Alaskan Athabascans | 99.9 /100 | #67 | Exceptional 21.9% |
| British | 99.9 /100 | #68 | Exceptional 21.9% |
| Creek | 99.9 /100 | #69 | Exceptional 21.9% |
| Bangladeshis | 99.8 /100 | #70 | Exceptional 21.9% |
| Potawatomi | 99.8 /100 | #71 | Exceptional 21.9% |
| Portuguese | 99.8 /100 | #72 | Exceptional 21.8% |
| Salvadorans | 99.8 /100 | #73 | Exceptional 21.8% |
| Immigrants | Oceania | 99.8 /100 | #74 | Exceptional 21.8% |
| Japanese | 99.8 /100 | #75 | Exceptional 21.8% |