Argentinean vs Tohono O'odham Householder Income Under 25 years
COMPARE
Argentinean
Tohono O'odham
Householder Income Under 25 years
Householder Income Under 25 years Comparison
Argentineans
Tohono O'odham
$54,154
HOUSEHOLDER INCOME UNDER 25 YEARS
99.2/ 100
METRIC RATING
96th/ 347
METRIC RANK
$45,248
HOUSEHOLDER INCOME UNDER 25 YEARS
0.0/ 100
METRIC RATING
336th/ 347
METRIC RANK
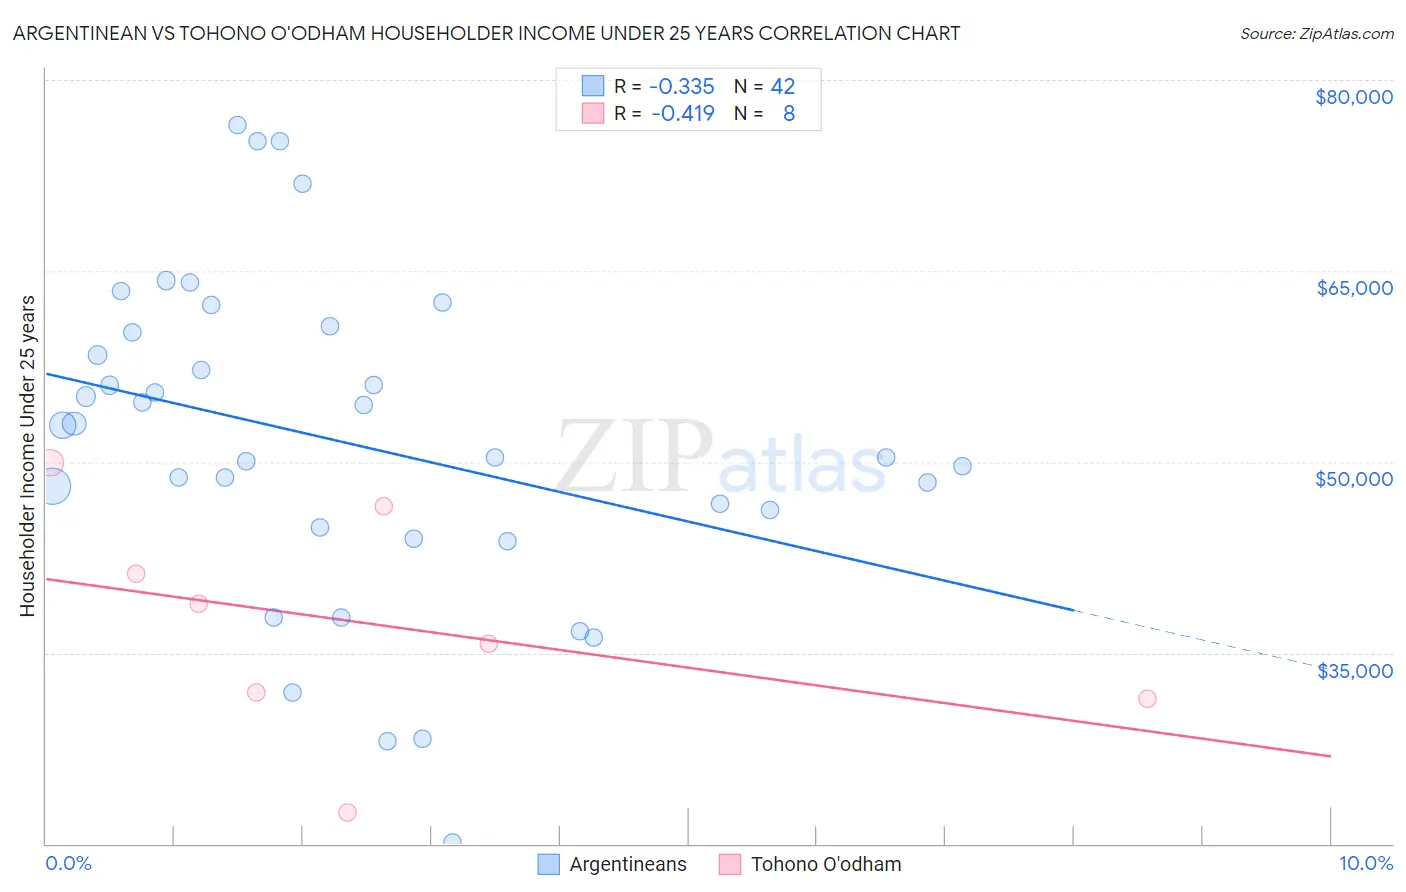
Argentinean vs Tohono O'odham Householder Income Under 25 years Correlation Chart
The statistical analysis conducted on geographies consisting of 257,126,127 people shows a mild negative correlation between the proportion of Argentineans and household income with householder under the age of 25 in the United States with a correlation coefficient (R) of -0.335 and weighted average of $54,154. Similarly, the statistical analysis conducted on geographies consisting of 56,811,547 people shows a moderate negative correlation between the proportion of Tohono O'odham and household income with householder under the age of 25 in the United States with a correlation coefficient (R) of -0.419 and weighted average of $45,248, a difference of 19.7%.
Householder Income Under 25 years Correlation Summary
| Measurement | Argentinean | Tohono O'odham |
| Minimum | $20,094 | $22,412 |
| Maximum | $76,444 | $49,920 |
| Range | $56,350 | $27,507 |
| Mean | $51,569 | $37,222 |
| Median | $51,595 | $37,258 |
| Interquartile 25% (IQ1) | $44,853 | $31,632 |
| Interquartile 75% (IQ3) | $60,142 | $43,831 |
| Interquartile Range (IQR) | $15,290 | $12,199 |
| Standard Deviation (Sample) | $12,822 | $8,859 |
| Standard Deviation (Population) | $12,668 | $8,287 |
Similar Demographics by Householder Income Under 25 years
Demographics Similar to Argentineans by Householder Income Under 25 years
In terms of householder income under 25 years, the demographic groups most similar to Argentineans are Immigrants from Malaysia ($54,179, a difference of 0.050%), Immigrants from Sierra Leone ($54,190, a difference of 0.070%), Immigrants from Portugal ($54,105, a difference of 0.090%), Immigrants from Argentina ($54,209, a difference of 0.10%), and Immigrants from St. Vincent and the Grenadines ($54,230, a difference of 0.14%).
| Demographics | Rating | Rank | Householder Income Under 25 years |
| Immigrants | South America | 99.4 /100 | #89 | Exceptional $54,268 |
| Turks | 99.4 /100 | #90 | Exceptional $54,266 |
| Immigrants | Egypt | 99.3 /100 | #91 | Exceptional $54,239 |
| Immigrants | St. Vincent and the Grenadines | 99.3 /100 | #92 | Exceptional $54,230 |
| Immigrants | Argentina | 99.3 /100 | #93 | Exceptional $54,209 |
| Immigrants | Sierra Leone | 99.3 /100 | #94 | Exceptional $54,190 |
| Immigrants | Malaysia | 99.2 /100 | #95 | Exceptional $54,179 |
| Argentineans | 99.2 /100 | #96 | Exceptional $54,154 |
| Immigrants | Portugal | 99.1 /100 | #97 | Exceptional $54,105 |
| Eastern Europeans | 99.0 /100 | #98 | Exceptional $54,066 |
| Alaska Natives | 98.8 /100 | #99 | Exceptional $54,000 |
| Immigrants | Kazakhstan | 98.8 /100 | #100 | Exceptional $53,990 |
| South Americans | 98.6 /100 | #101 | Exceptional $53,939 |
| Ecuadorians | 98.5 /100 | #102 | Exceptional $53,911 |
| Ukrainians | 98.3 /100 | #103 | Exceptional $53,843 |
Demographics Similar to Tohono O'odham by Householder Income Under 25 years
In terms of householder income under 25 years, the demographic groups most similar to Tohono O'odham are Cheyenne ($45,275, a difference of 0.060%), Cajun ($45,338, a difference of 0.20%), Creek ($45,371, a difference of 0.27%), Choctaw ($45,450, a difference of 0.45%), and Pueblo ($45,018, a difference of 0.51%).
| Demographics | Rating | Rank | Householder Income Under 25 years |
| Seminole | 0.0 /100 | #329 | Tragic $45,649 |
| Indonesians | 0.0 /100 | #330 | Tragic $45,566 |
| Immigrants | Zaire | 0.0 /100 | #331 | Tragic $45,529 |
| Choctaw | 0.0 /100 | #332 | Tragic $45,450 |
| Creek | 0.0 /100 | #333 | Tragic $45,371 |
| Cajuns | 0.0 /100 | #334 | Tragic $45,338 |
| Cheyenne | 0.0 /100 | #335 | Tragic $45,275 |
| Tohono O'odham | 0.0 /100 | #336 | Tragic $45,248 |
| Pueblo | 0.0 /100 | #337 | Tragic $45,018 |
| Chickasaw | 0.0 /100 | #338 | Tragic $44,763 |
| Kiowa | 0.0 /100 | #339 | Tragic $44,733 |
| Blacks/African Americans | 0.0 /100 | #340 | Tragic $44,381 |
| Houma | 0.0 /100 | #341 | Tragic $44,356 |
| Arapaho | 0.0 /100 | #342 | Tragic $44,003 |
| Immigrants | Yemen | 0.0 /100 | #343 | Tragic $43,591 |