Arab vs Immigrants from Latin America Cognitive Disability
COMPARE
Arab
Immigrants from Latin America
Cognitive Disability
Cognitive Disability Comparison
Arabs
Immigrants from Latin America
17.3%
COGNITIVE DISABILITY
42.8/ 100
METRIC RATING
182nd/ 347
METRIC RANK
17.6%
COGNITIVE DISABILITY
9.7/ 100
METRIC RATING
207th/ 347
METRIC RANK
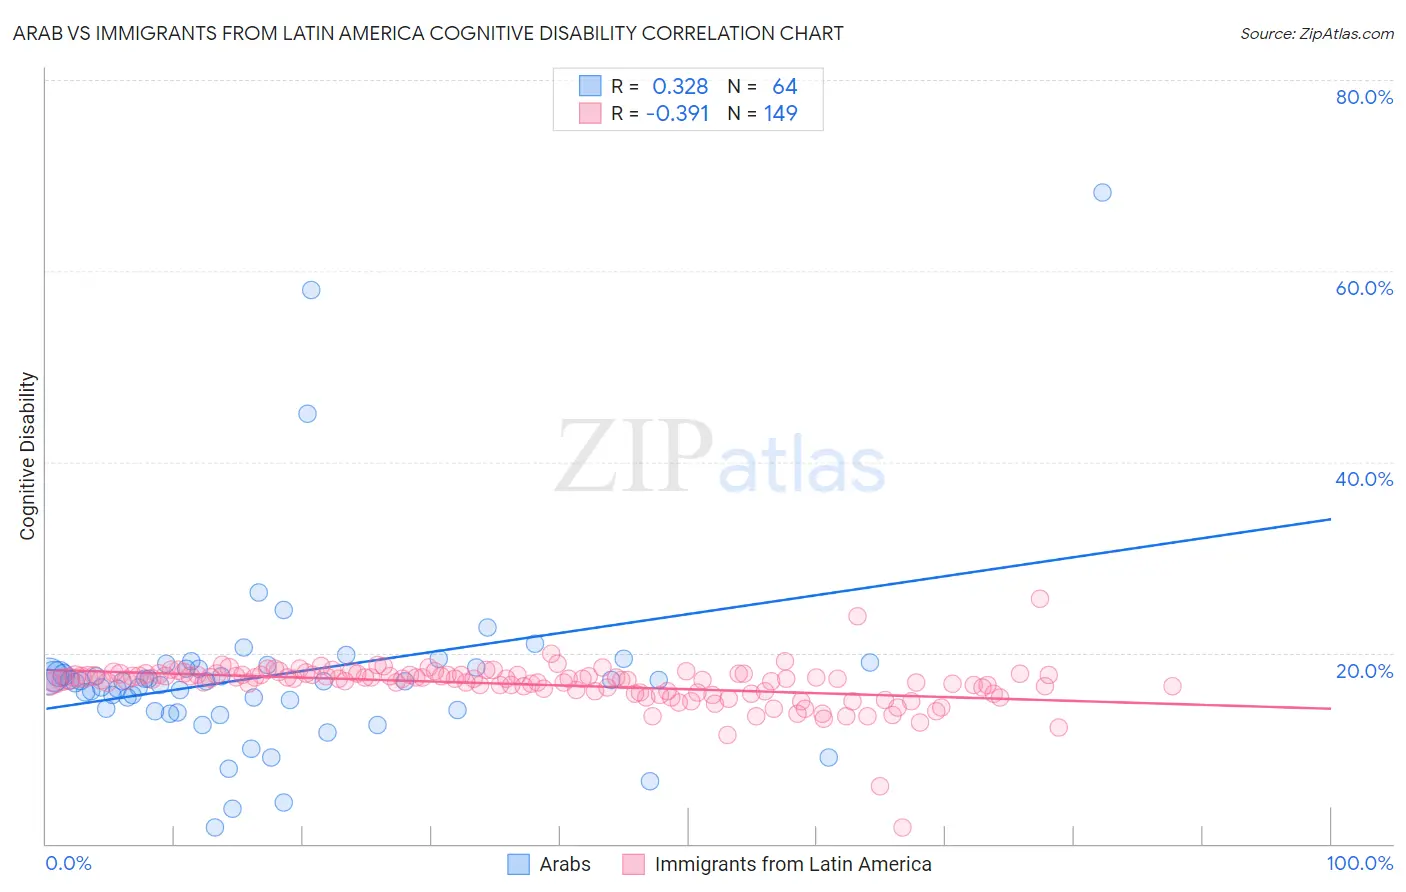
Arab vs Immigrants from Latin America Cognitive Disability Correlation Chart
The statistical analysis conducted on geographies consisting of 486,790,065 people shows a mild positive correlation between the proportion of Arabs and percentage of population with cognitive disability in the United States with a correlation coefficient (R) of 0.328 and weighted average of 17.3%. Similarly, the statistical analysis conducted on geographies consisting of 558,464,403 people shows a mild negative correlation between the proportion of Immigrants from Latin America and percentage of population with cognitive disability in the United States with a correlation coefficient (R) of -0.391 and weighted average of 17.6%, a difference of 1.4%.
Cognitive Disability Correlation Summary
| Measurement | Arab | Immigrants from Latin America |
| Minimum | 1.6% | 1.8% |
| Maximum | 68.2% | 25.7% |
| Range | 66.6% | 23.9% |
| Mean | 17.7% | 16.7% |
| Median | 17.1% | 17.3% |
| Interquartile 25% (IQ1) | 14.1% | 16.0% |
| Interquartile 75% (IQ3) | 18.4% | 17.7% |
| Interquartile Range (IQR) | 4.3% | 1.7% |
| Standard Deviation (Sample) | 10.1% | 2.3% |
| Standard Deviation (Population) | 10.0% | 2.3% |
Similar Demographics by Cognitive Disability
Demographics Similar to Arabs by Cognitive Disability
In terms of cognitive disability, the demographic groups most similar to Arabs are Immigrants from Guyana (17.3%, a difference of 0.0%), Pakistani (17.3%, a difference of 0.030%), Spaniard (17.3%, a difference of 0.070%), Crow (17.3%, a difference of 0.11%), and Afghan (17.3%, a difference of 0.14%).
| Demographics | Rating | Rank | Cognitive Disability |
| Tsimshian | 49.8 /100 | #175 | Average 17.3% |
| Shoshone | 49.2 /100 | #176 | Average 17.3% |
| Ute | 49.1 /100 | #177 | Average 17.3% |
| Spanish | 48.9 /100 | #178 | Average 17.3% |
| Sioux | 48.6 /100 | #179 | Average 17.3% |
| Pakistanis | 43.9 /100 | #180 | Average 17.3% |
| Immigrants | Guyana | 42.9 /100 | #181 | Average 17.3% |
| Arabs | 42.8 /100 | #182 | Average 17.3% |
| Spaniards | 40.3 /100 | #183 | Average 17.3% |
| Crow | 39.1 /100 | #184 | Fair 17.3% |
| Afghans | 38.2 /100 | #185 | Fair 17.3% |
| Cambodians | 35.9 /100 | #186 | Fair 17.3% |
| Immigrants | Fiji | 33.7 /100 | #187 | Fair 17.4% |
| Immigrants | France | 29.8 /100 | #188 | Fair 17.4% |
| Immigrants | Western Asia | 29.5 /100 | #189 | Fair 17.4% |
Demographics Similar to Immigrants from Latin America by Cognitive Disability
In terms of cognitive disability, the demographic groups most similar to Immigrants from Latin America are Immigrants from Cameroon (17.6%, a difference of 0.030%), Alaska Native (17.5%, a difference of 0.050%), Immigrants from Trinidad and Tobago (17.6%, a difference of 0.080%), Puget Sound Salish (17.5%, a difference of 0.090%), and Immigrants from Caribbean (17.5%, a difference of 0.10%).
| Demographics | Rating | Rank | Cognitive Disability |
| Haitians | 14.1 /100 | #200 | Poor 17.5% |
| South American Indians | 13.0 /100 | #201 | Poor 17.5% |
| Immigrants | Morocco | 12.0 /100 | #202 | Poor 17.5% |
| Immigrants | Caribbean | 11.0 /100 | #203 | Poor 17.5% |
| Immigrants | Zimbabwe | 11.0 /100 | #204 | Poor 17.5% |
| Puget Sound Salish | 10.9 /100 | #205 | Poor 17.5% |
| Alaska Natives | 10.4 /100 | #206 | Poor 17.5% |
| Immigrants | Latin America | 9.7 /100 | #207 | Tragic 17.6% |
| Immigrants | Cameroon | 9.3 /100 | #208 | Tragic 17.6% |
| Immigrants | Trinidad and Tobago | 8.7 /100 | #209 | Tragic 17.6% |
| Immigrants | Jamaica | 8.5 /100 | #210 | Tragic 17.6% |
| Taiwanese | 7.7 /100 | #211 | Tragic 17.6% |
| Immigrants | Oceania | 7.3 /100 | #212 | Tragic 17.6% |
| Hawaiians | 7.2 /100 | #213 | Tragic 17.6% |
| Immigrants | El Salvador | 7.0 /100 | #214 | Tragic 17.6% |