Albanian vs Immigrants from Burma/Myanmar Child Poverty Among Boys Under 16
COMPARE
Albanian
Immigrants from Burma/Myanmar
Child Poverty Among Boys Under 16
Child Poverty Among Boys Under 16 Comparison
Albanians
Immigrants from Burma/Myanmar
15.6%
CHILD POVERTY AMONG BOYS UNDER 16
86.5/ 100
METRIC RATING
139th/ 347
METRIC RANK
19.2%
CHILD POVERTY AMONG BOYS UNDER 16
0.2/ 100
METRIC RATING
250th/ 347
METRIC RANK
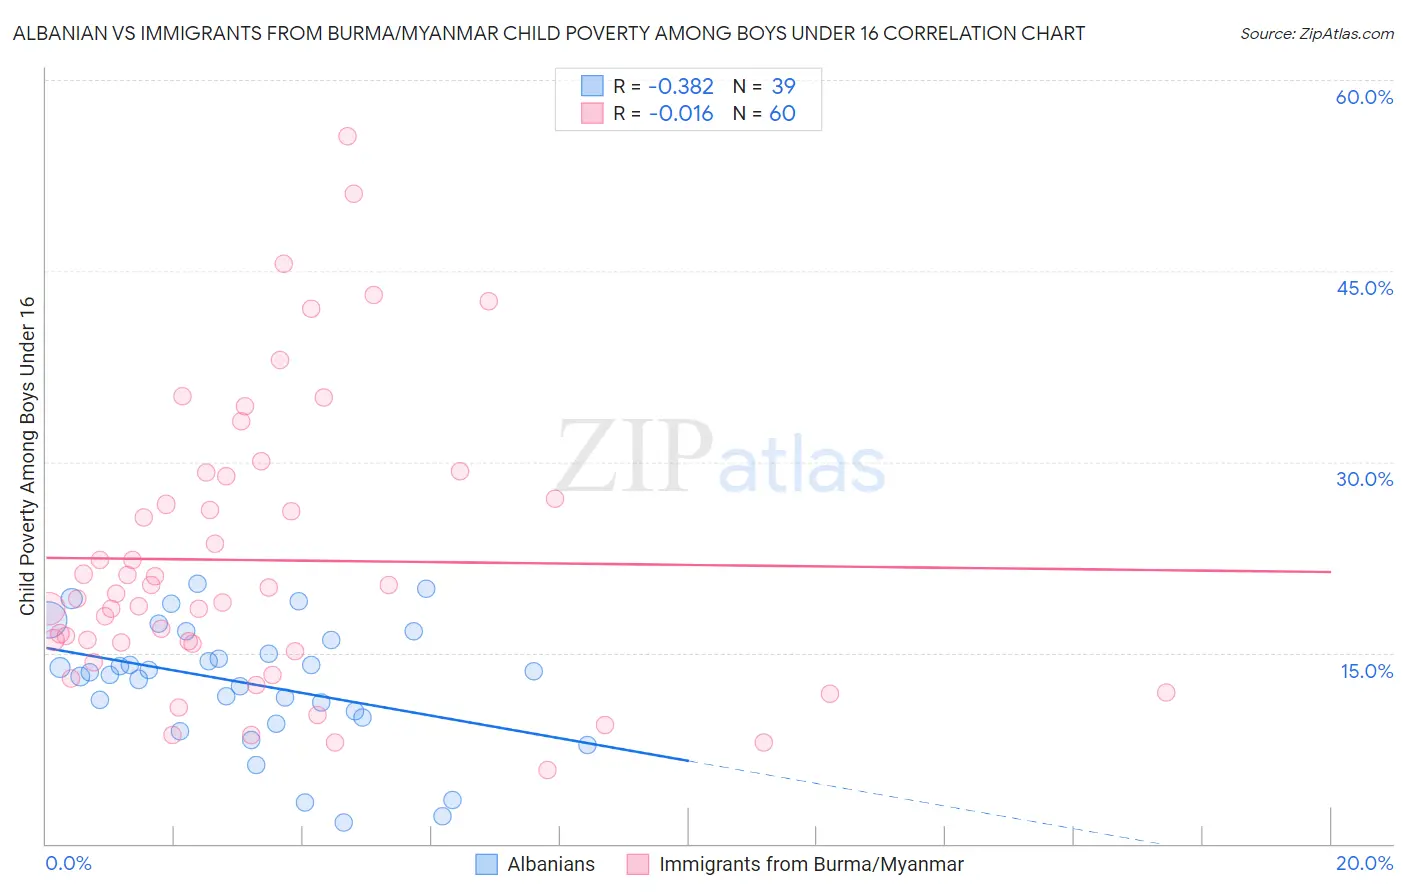
Albanian vs Immigrants from Burma/Myanmar Child Poverty Among Boys Under 16 Correlation Chart
The statistical analysis conducted on geographies consisting of 190,811,063 people shows a mild negative correlation between the proportion of Albanians and poverty level among boys under the age of 16 in the United States with a correlation coefficient (R) of -0.382 and weighted average of 15.6%. Similarly, the statistical analysis conducted on geographies consisting of 171,312,053 people shows no correlation between the proportion of Immigrants from Burma/Myanmar and poverty level among boys under the age of 16 in the United States with a correlation coefficient (R) of -0.016 and weighted average of 19.2%, a difference of 23.3%.
Child Poverty Among Boys Under 16 Correlation Summary
| Measurement | Albanian | Immigrants from Burma/Myanmar |
| Minimum | 1.7% | 5.8% |
| Maximum | 20.4% | 55.6% |
| Range | 18.7% | 49.8% |
| Mean | 12.6% | 22.3% |
| Median | 13.5% | 19.5% |
| Interquartile 25% (IQ1) | 9.9% | 15.4% |
| Interquartile 75% (IQ3) | 16.0% | 28.0% |
| Interquartile Range (IQR) | 6.1% | 12.6% |
| Standard Deviation (Sample) | 4.8% | 11.2% |
| Standard Deviation (Population) | 4.8% | 11.1% |
Similar Demographics by Child Poverty Among Boys Under 16
Demographics Similar to Albanians by Child Poverty Among Boys Under 16
In terms of child poverty among boys under 16, the demographic groups most similar to Albanians are Immigrants from Southern Europe (15.6%, a difference of 0.010%), Immigrants from Spain (15.6%, a difference of 0.15%), Immigrants from Kuwait (15.6%, a difference of 0.22%), Icelander (15.5%, a difference of 0.25%), and Portuguese (15.5%, a difference of 0.27%).
| Demographics | Rating | Rank | Child Poverty Among Boys Under 16 |
| Immigrants | Kazakhstan | 88.7 /100 | #132 | Excellent 15.5% |
| Welsh | 88.3 /100 | #133 | Excellent 15.5% |
| Peruvians | 88.1 /100 | #134 | Excellent 15.5% |
| Portuguese | 87.5 /100 | #135 | Excellent 15.5% |
| Icelanders | 87.5 /100 | #136 | Excellent 15.5% |
| Immigrants | Spain | 87.1 /100 | #137 | Excellent 15.6% |
| Immigrants | Southern Europe | 86.5 /100 | #138 | Excellent 15.6% |
| Albanians | 86.5 /100 | #139 | Excellent 15.6% |
| Immigrants | Kuwait | 85.6 /100 | #140 | Excellent 15.6% |
| Slavs | 84.5 /100 | #141 | Excellent 15.7% |
| Immigrants | Hungary | 84.1 /100 | #142 | Excellent 15.7% |
| Immigrants | Fiji | 83.6 /100 | #143 | Excellent 15.7% |
| Immigrants | Peru | 83.5 /100 | #144 | Excellent 15.7% |
| Samoans | 83.2 /100 | #145 | Excellent 15.7% |
| New Zealanders | 82.4 /100 | #146 | Excellent 15.7% |
Demographics Similar to Immigrants from Burma/Myanmar by Child Poverty Among Boys Under 16
In terms of child poverty among boys under 16, the demographic groups most similar to Immigrants from Burma/Myanmar are French American Indian (19.2%, a difference of 0.030%), Immigrants from Western Africa (19.3%, a difference of 0.26%), Liberian (19.3%, a difference of 0.33%), Trinidadian and Tobagonian (19.3%, a difference of 0.60%), and Ecuadorian (19.3%, a difference of 0.60%).
| Demographics | Rating | Rank | Child Poverty Among Boys Under 16 |
| Immigrants | Azores | 0.4 /100 | #243 | Tragic 18.9% |
| Immigrants | Middle Africa | 0.4 /100 | #244 | Tragic 18.9% |
| Cree | 0.4 /100 | #245 | Tragic 19.0% |
| Immigrants | Nicaragua | 0.4 /100 | #246 | Tragic 19.0% |
| Immigrants | Trinidad and Tobago | 0.3 /100 | #247 | Tragic 19.0% |
| Salvadorans | 0.3 /100 | #248 | Tragic 19.0% |
| Alsatians | 0.3 /100 | #249 | Tragic 19.1% |
| Immigrants | Burma/Myanmar | 0.2 /100 | #250 | Tragic 19.2% |
| French American Indians | 0.2 /100 | #251 | Tragic 19.2% |
| Immigrants | Western Africa | 0.2 /100 | #252 | Tragic 19.3% |
| Liberians | 0.2 /100 | #253 | Tragic 19.3% |
| Trinidadians and Tobagonians | 0.2 /100 | #254 | Tragic 19.3% |
| Ecuadorians | 0.2 /100 | #255 | Tragic 19.3% |
| Immigrants | Liberia | 0.2 /100 | #256 | Tragic 19.3% |
| Mexican American Indians | 0.2 /100 | #257 | Tragic 19.4% |