Greek vs Turkish 3 or more Vehicles in Household
COMPARE
Greek
Turkish
3 or more Vehicles in Household
3 or more Vehicles in Household Comparison
Greeks
Turks
20.3%
3 OR MORE VEHICLES IN HOUSEHOLD
88.6/ 100
METRIC RATING
130th/ 347
METRIC RANK
18.4%
3 OR MORE VEHICLES IN HOUSEHOLD
5.4/ 100
METRIC RATING
228th/ 347
METRIC RANK
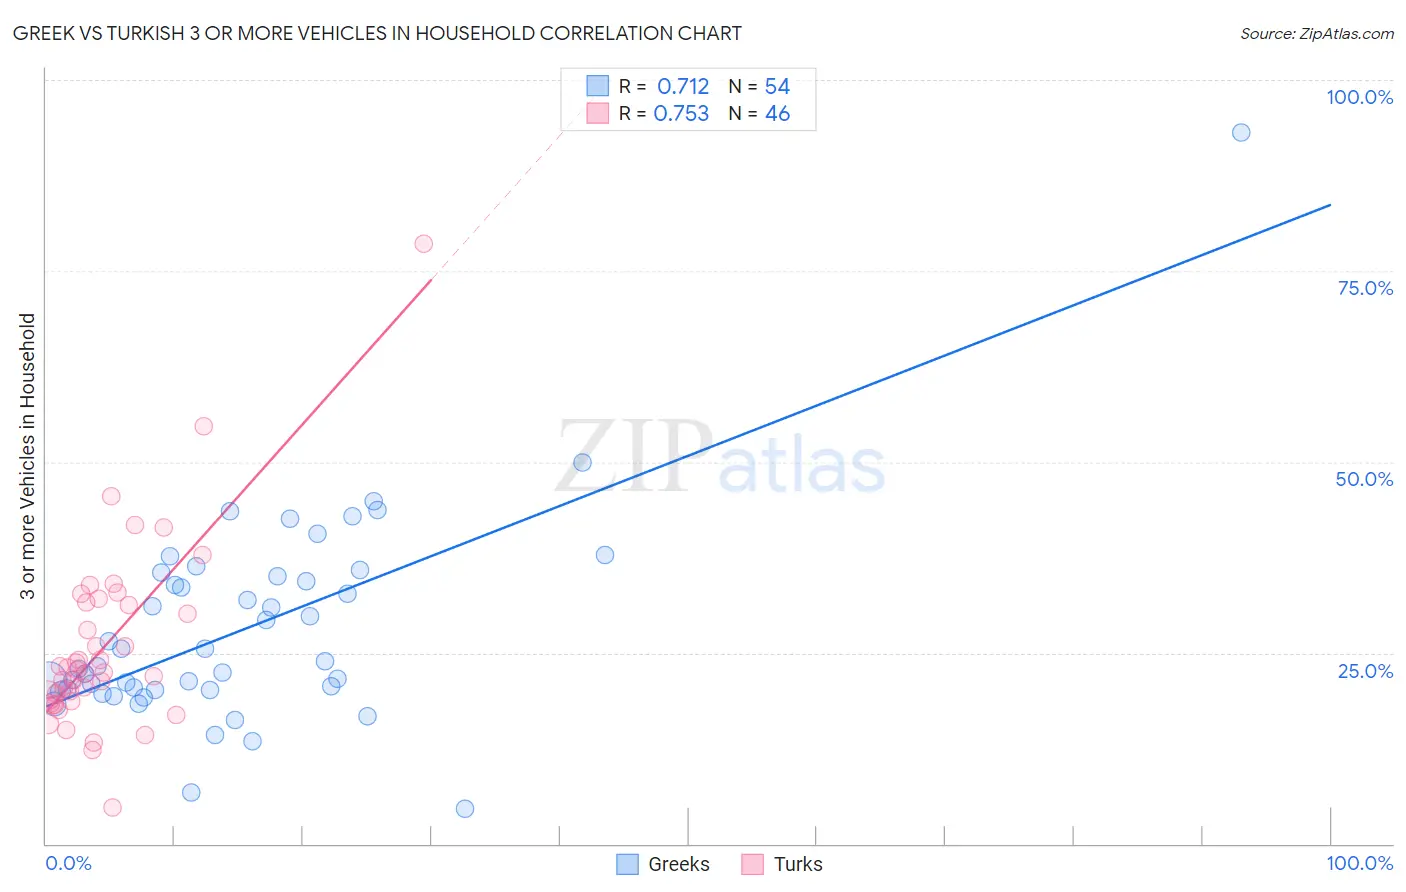
Greek vs Turkish 3 or more Vehicles in Household Correlation Chart
The statistical analysis conducted on geographies consisting of 482,172,821 people shows a strong positive correlation between the proportion of Greeks and percentage of households with 3 or more vehicles available in the United States with a correlation coefficient (R) of 0.712 and weighted average of 20.3%. Similarly, the statistical analysis conducted on geographies consisting of 271,619,794 people shows a strong positive correlation between the proportion of Turks and percentage of households with 3 or more vehicles available in the United States with a correlation coefficient (R) of 0.753 and weighted average of 18.4%, a difference of 9.8%.
3 or more Vehicles in Household Correlation Summary
| Measurement | Greek | Turkish |
| Minimum | 4.5% | 4.7% |
| Maximum | 93.1% | 78.6% |
| Range | 88.5% | 73.9% |
| Mean | 28.0% | 25.9% |
| Median | 23.6% | 22.6% |
| Interquartile 25% (IQ1) | 20.1% | 18.7% |
| Interquartile 75% (IQ3) | 35.0% | 31.6% |
| Interquartile Range (IQR) | 14.8% | 12.8% |
| Standard Deviation (Sample) | 13.4% | 12.3% |
| Standard Deviation (Population) | 13.3% | 12.2% |
Similar Demographics by 3 or more Vehicles in Household
Demographics Similar to Greeks by 3 or more Vehicles in Household
In terms of 3 or more vehicles in household, the demographic groups most similar to Greeks are Zimbabwean (20.3%, a difference of 0.030%), Immigrants from Asia (20.2%, a difference of 0.070%), Immigrants from Canada (20.2%, a difference of 0.13%), Immigrants from North America (20.2%, a difference of 0.13%), and Polish (20.2%, a difference of 0.22%).
| Demographics | Rating | Rank | 3 or more Vehicles in Household |
| Immigrants | Korea | 93.7 /100 | #123 | Exceptional 20.5% |
| Central Americans | 93.1 /100 | #124 | Exceptional 20.5% |
| Immigrants | Netherlands | 92.9 /100 | #125 | Exceptional 20.4% |
| Slavs | 92.1 /100 | #126 | Exceptional 20.4% |
| Immigrants | Bolivia | 92.0 /100 | #127 | Exceptional 20.4% |
| New Zealanders | 91.3 /100 | #128 | Exceptional 20.4% |
| Zimbabweans | 88.7 /100 | #129 | Excellent 20.3% |
| Greeks | 88.6 /100 | #130 | Excellent 20.3% |
| Immigrants | Asia | 88.1 /100 | #131 | Excellent 20.2% |
| Immigrants | Canada | 87.8 /100 | #132 | Excellent 20.2% |
| Immigrants | North America | 87.8 /100 | #133 | Excellent 20.2% |
| Poles | 87.3 /100 | #134 | Excellent 20.2% |
| Immigrants | India | 87.2 /100 | #135 | Excellent 20.2% |
| Immigrants | Nicaragua | 87.1 /100 | #136 | Excellent 20.2% |
| Immigrants | Iraq | 87.1 /100 | #137 | Excellent 20.2% |
Demographics Similar to Turks by 3 or more Vehicles in Household
In terms of 3 or more vehicles in household, the demographic groups most similar to Turks are Immigrants from Singapore (18.4%, a difference of 0.020%), Immigrants from Hungary (18.5%, a difference of 0.050%), Immigrants from Lithuania (18.5%, a difference of 0.080%), Immigrants from Argentina (18.5%, a difference of 0.090%), and Immigrants from Switzerland (18.4%, a difference of 0.17%).
| Demographics | Rating | Rank | 3 or more Vehicles in Household |
| Immigrants | Poland | 7.5 /100 | #221 | Tragic 18.6% |
| Belizeans | 7.3 /100 | #222 | Tragic 18.6% |
| Immigrants | Czechoslovakia | 5.9 /100 | #223 | Tragic 18.5% |
| Immigrants | Argentina | 5.6 /100 | #224 | Tragic 18.5% |
| Immigrants | Lithuania | 5.6 /100 | #225 | Tragic 18.5% |
| Immigrants | Hungary | 5.5 /100 | #226 | Tragic 18.5% |
| Immigrants | Singapore | 5.4 /100 | #227 | Tragic 18.4% |
| Turks | 5.4 /100 | #228 | Tragic 18.4% |
| Immigrants | Switzerland | 5.0 /100 | #229 | Tragic 18.4% |
| Immigrants | Western Asia | 4.8 /100 | #230 | Tragic 18.4% |
| Immigrants | Belgium | 4.8 /100 | #231 | Tragic 18.4% |
| Immigrants | Uganda | 4.6 /100 | #232 | Tragic 18.4% |
| Hondurans | 4.6 /100 | #233 | Tragic 18.4% |
| Immigrants | North Macedonia | 4.4 /100 | #234 | Tragic 18.4% |
| Sierra Leoneans | 3.9 /100 | #235 | Tragic 18.3% |