Celtic vs Ottawa Unemployment
COMPARE
Celtic
Ottawa
Unemployment
Unemployment Comparison
Celtics
Ottawa
4.9%
UNEMPLOYMENT
99.1/ 100
METRIC RATING
56th/ 347
METRIC RANK
5.5%
UNEMPLOYMENT
5.4/ 100
METRIC RATING
230th/ 347
METRIC RANK
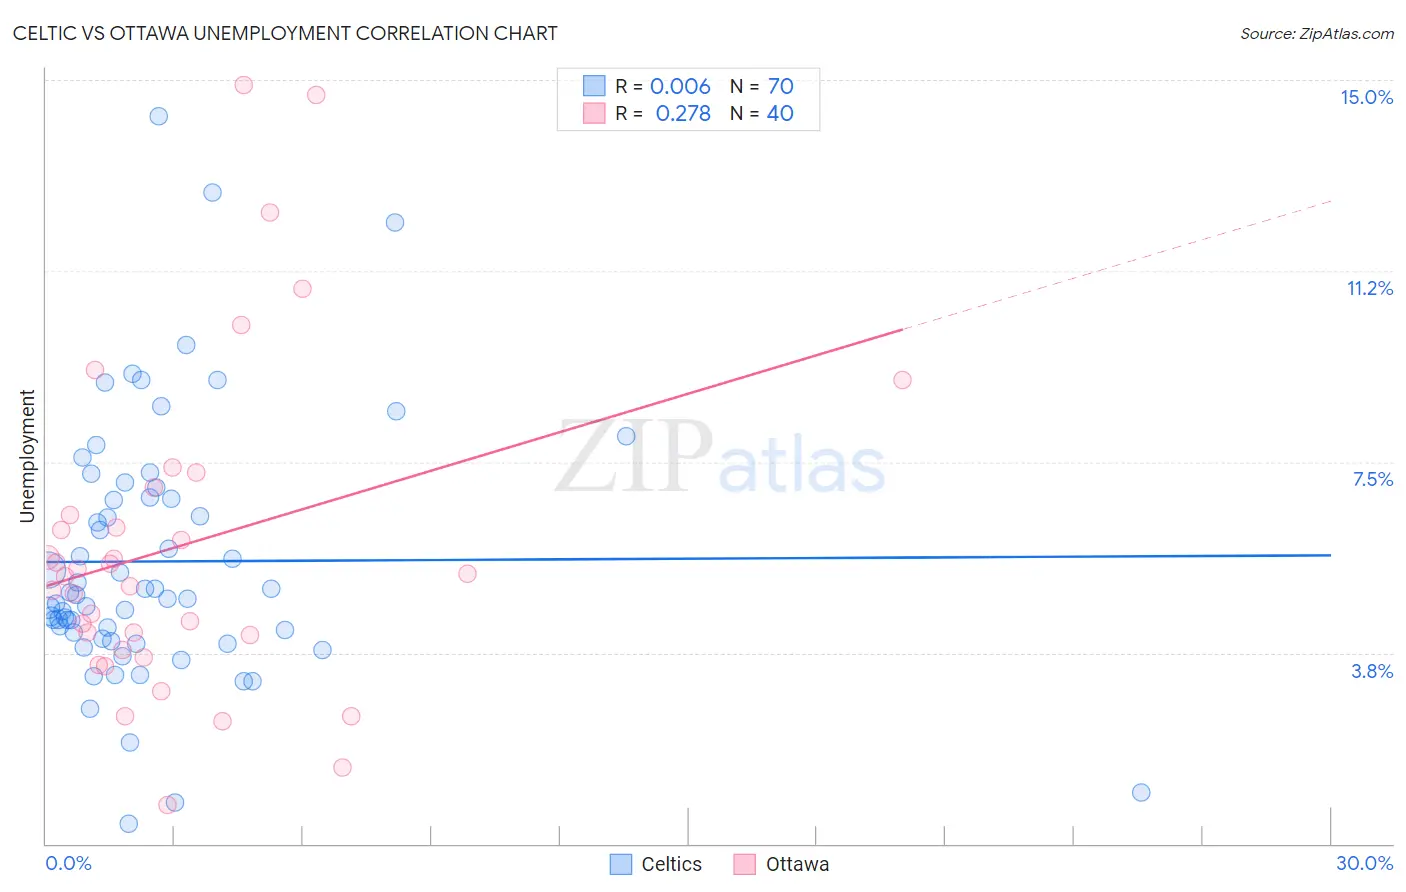
Celtic vs Ottawa Unemployment Correlation Chart
The statistical analysis conducted on geographies consisting of 168,747,363 people shows no correlation between the proportion of Celtics and unemployment in the United States with a correlation coefficient (R) of 0.006 and weighted average of 4.9%. Similarly, the statistical analysis conducted on geographies consisting of 49,942,125 people shows a weak positive correlation between the proportion of Ottawa and unemployment in the United States with a correlation coefficient (R) of 0.278 and weighted average of 5.5%, a difference of 12.5%.
Unemployment Correlation Summary
| Measurement | Celtic | Ottawa |
| Minimum | 0.40% | 0.77% |
| Maximum | 14.3% | 14.9% |
| Range | 13.9% | 14.1% |
| Mean | 5.5% | 5.8% |
| Median | 4.8% | 5.3% |
| Interquartile 25% (IQ1) | 4.0% | 4.0% |
| Interquartile 75% (IQ3) | 6.8% | 6.7% |
| Interquartile Range (IQR) | 2.8% | 2.8% |
| Standard Deviation (Sample) | 2.6% | 3.2% |
| Standard Deviation (Population) | 2.6% | 3.2% |
Similar Demographics by Unemployment
Demographics Similar to Celtics by Unemployment
In terms of unemployment, the demographic groups most similar to Celtics are Immigrants from Singapore (4.9%, a difference of 0.070%), Australian (4.9%, a difference of 0.16%), Greek (4.9%, a difference of 0.17%), Eastern European (4.9%, a difference of 0.19%), and Bhutanese (4.9%, a difference of 0.20%).
| Demographics | Rating | Rank | Unemployment |
| Immigrants | South Central Asia | 99.3 /100 | #49 | Exceptional 4.9% |
| French Canadians | 99.3 /100 | #50 | Exceptional 4.9% |
| Immigrants | Belgium | 99.2 /100 | #51 | Exceptional 4.9% |
| Whites/Caucasians | 99.2 /100 | #52 | Exceptional 4.9% |
| Immigrants | Zimbabwe | 99.2 /100 | #53 | Exceptional 4.9% |
| Eastern Europeans | 99.2 /100 | #54 | Exceptional 4.9% |
| Australians | 99.2 /100 | #55 | Exceptional 4.9% |
| Celtics | 99.1 /100 | #56 | Exceptional 4.9% |
| Immigrants | Singapore | 99.1 /100 | #57 | Exceptional 4.9% |
| Greeks | 99.0 /100 | #58 | Exceptional 4.9% |
| Bhutanese | 99.0 /100 | #59 | Exceptional 4.9% |
| Immigrants | Netherlands | 99.0 /100 | #60 | Exceptional 4.9% |
| Cambodians | 99.0 /100 | #61 | Exceptional 4.9% |
| Icelanders | 98.9 /100 | #62 | Exceptional 4.9% |
| Immigrants | Bulgaria | 98.9 /100 | #63 | Exceptional 4.9% |
Demographics Similar to Ottawa by Unemployment
In terms of unemployment, the demographic groups most similar to Ottawa are Hawaiian (5.5%, a difference of 0.0%), Immigrants from Africa (5.5%, a difference of 0.13%), Comanche (5.5%, a difference of 0.13%), Immigrants from Syria (5.5%, a difference of 0.18%), and Panamanian (5.5%, a difference of 0.21%).
| Demographics | Rating | Rank | Unemployment |
| Seminole | 9.2 /100 | #223 | Tragic 5.4% |
| Israelis | 8.8 /100 | #224 | Tragic 5.4% |
| South American Indians | 7.8 /100 | #225 | Tragic 5.5% |
| Samoans | 7.1 /100 | #226 | Tragic 5.5% |
| Immigrants | Lebanon | 7.0 /100 | #227 | Tragic 5.5% |
| Guamanians/Chamorros | 6.3 /100 | #228 | Tragic 5.5% |
| Hawaiians | 5.4 /100 | #229 | Tragic 5.5% |
| Ottawa | 5.4 /100 | #230 | Tragic 5.5% |
| Immigrants | Africa | 4.9 /100 | #231 | Tragic 5.5% |
| Comanche | 4.9 /100 | #232 | Tragic 5.5% |
| Immigrants | Syria | 4.8 /100 | #233 | Tragic 5.5% |
| Panamanians | 4.7 /100 | #234 | Tragic 5.5% |
| Immigrants | Panama | 3.4 /100 | #235 | Tragic 5.5% |
| Immigrants | Cambodia | 3.3 /100 | #236 | Tragic 5.5% |
| Moroccans | 3.2 /100 | #237 | Tragic 5.5% |