Celtic vs Immigrants from Honduras Unemployment
COMPARE
Celtic
Immigrants from Honduras
Unemployment
Unemployment Comparison
Celtics
Immigrants from Honduras
4.9%
UNEMPLOYMENT
99.1/ 100
METRIC RATING
56th/ 347
METRIC RANK
5.7%
UNEMPLOYMENT
0.3/ 100
METRIC RATING
254th/ 347
METRIC RANK
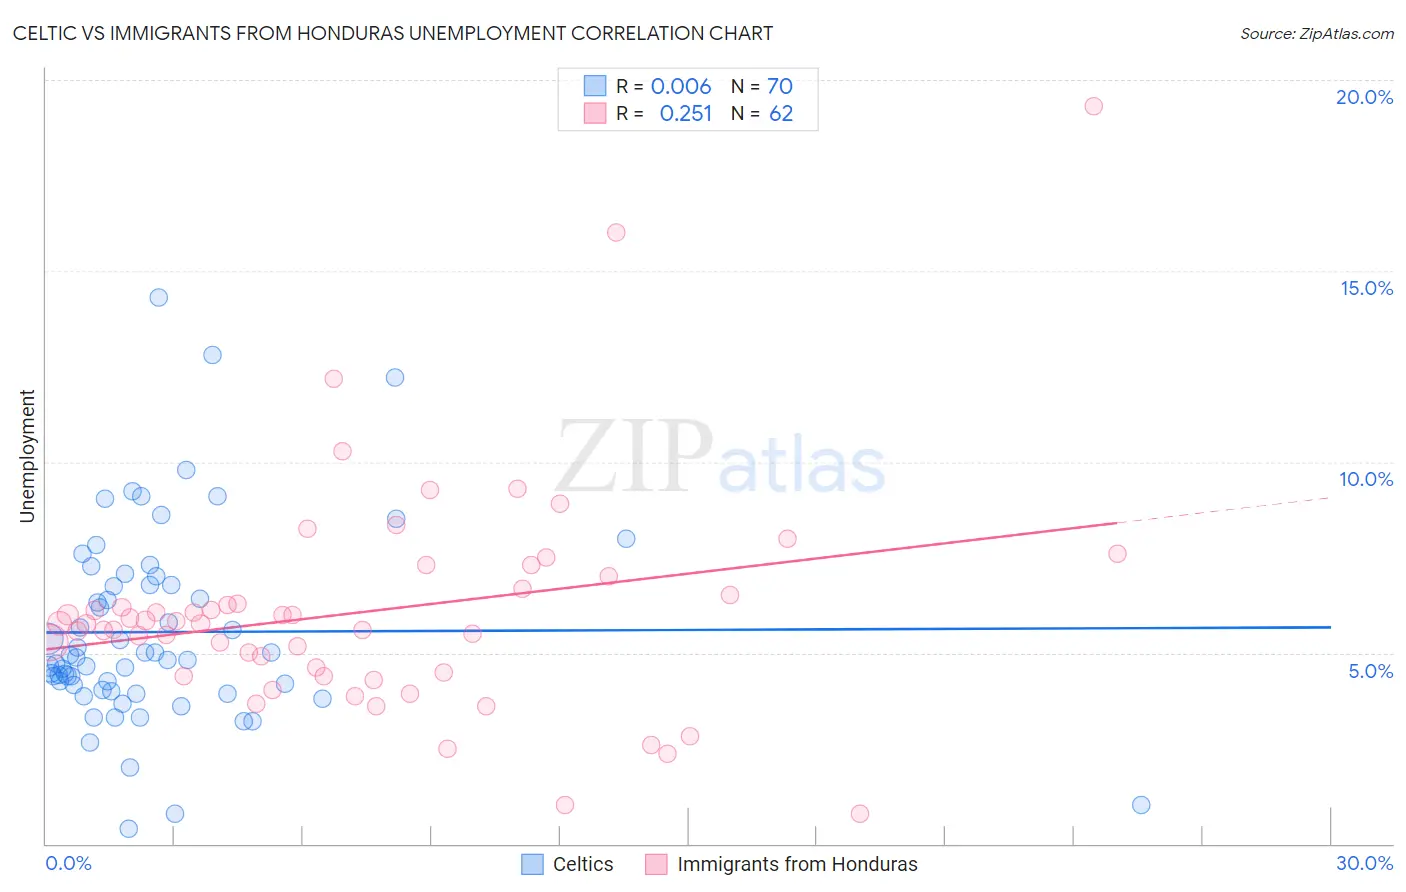
Celtic vs Immigrants from Honduras Unemployment Correlation Chart
The statistical analysis conducted on geographies consisting of 168,747,363 people shows no correlation between the proportion of Celtics and unemployment in the United States with a correlation coefficient (R) of 0.006 and weighted average of 4.9%. Similarly, the statistical analysis conducted on geographies consisting of 322,382,212 people shows a weak positive correlation between the proportion of Immigrants from Honduras and unemployment in the United States with a correlation coefficient (R) of 0.251 and weighted average of 5.7%, a difference of 17.3%.
Unemployment Correlation Summary
| Measurement | Celtic | Immigrants from Honduras |
| Minimum | 0.40% | 0.80% |
| Maximum | 14.3% | 19.3% |
| Range | 13.9% | 18.5% |
| Mean | 5.5% | 6.1% |
| Median | 4.8% | 5.8% |
| Interquartile 25% (IQ1) | 4.0% | 4.5% |
| Interquartile 75% (IQ3) | 6.8% | 6.7% |
| Interquartile Range (IQR) | 2.8% | 2.2% |
| Standard Deviation (Sample) | 2.6% | 3.0% |
| Standard Deviation (Population) | 2.6% | 2.9% |
Similar Demographics by Unemployment
Demographics Similar to Celtics by Unemployment
In terms of unemployment, the demographic groups most similar to Celtics are Immigrants from Singapore (4.9%, a difference of 0.070%), Australian (4.9%, a difference of 0.16%), Greek (4.9%, a difference of 0.17%), Eastern European (4.9%, a difference of 0.19%), and Bhutanese (4.9%, a difference of 0.20%).
| Demographics | Rating | Rank | Unemployment |
| Immigrants | South Central Asia | 99.3 /100 | #49 | Exceptional 4.9% |
| French Canadians | 99.3 /100 | #50 | Exceptional 4.9% |
| Immigrants | Belgium | 99.2 /100 | #51 | Exceptional 4.9% |
| Whites/Caucasians | 99.2 /100 | #52 | Exceptional 4.9% |
| Immigrants | Zimbabwe | 99.2 /100 | #53 | Exceptional 4.9% |
| Eastern Europeans | 99.2 /100 | #54 | Exceptional 4.9% |
| Australians | 99.2 /100 | #55 | Exceptional 4.9% |
| Celtics | 99.1 /100 | #56 | Exceptional 4.9% |
| Immigrants | Singapore | 99.1 /100 | #57 | Exceptional 4.9% |
| Greeks | 99.0 /100 | #58 | Exceptional 4.9% |
| Bhutanese | 99.0 /100 | #59 | Exceptional 4.9% |
| Immigrants | Netherlands | 99.0 /100 | #60 | Exceptional 4.9% |
| Cambodians | 99.0 /100 | #61 | Exceptional 4.9% |
| Icelanders | 98.9 /100 | #62 | Exceptional 4.9% |
| Immigrants | Bulgaria | 98.9 /100 | #63 | Exceptional 4.9% |
Demographics Similar to Immigrants from Honduras by Unemployment
In terms of unemployment, the demographic groups most similar to Immigrants from Honduras are Central American (5.7%, a difference of 0.070%), Honduran (5.7%, a difference of 0.080%), Immigrants from Portugal (5.7%, a difference of 0.44%), Guatemalan (5.8%, a difference of 0.65%), and Kiowa (5.7%, a difference of 0.83%).
| Demographics | Rating | Rank | Unemployment |
| Immigrants | Cameroon | 1.0 /100 | #247 | Tragic 5.6% |
| Liberians | 0.9 /100 | #248 | Tragic 5.6% |
| Cajuns | 0.8 /100 | #249 | Tragic 5.6% |
| Japanese | 0.8 /100 | #250 | Tragic 5.6% |
| Kiowa | 0.6 /100 | #251 | Tragic 5.7% |
| Hondurans | 0.3 /100 | #252 | Tragic 5.7% |
| Central Americans | 0.3 /100 | #253 | Tragic 5.7% |
| Immigrants | Honduras | 0.3 /100 | #254 | Tragic 5.7% |
| Immigrants | Portugal | 0.2 /100 | #255 | Tragic 5.7% |
| Guatemalans | 0.2 /100 | #256 | Tragic 5.8% |
| Yaqui | 0.2 /100 | #257 | Tragic 5.8% |
| Immigrants | Bahamas | 0.1 /100 | #258 | Tragic 5.8% |
| Sub-Saharan Africans | 0.1 /100 | #259 | Tragic 5.8% |
| Immigrants | Uzbekistan | 0.1 /100 | #260 | Tragic 5.8% |
| Immigrants | Guatemala | 0.1 /100 | #261 | Tragic 5.8% |