Celtic vs Immigrants from Grenada Unemployment
COMPARE
Celtic
Immigrants from Grenada
Unemployment
Unemployment Comparison
Celtics
Immigrants from Grenada
4.9%
UNEMPLOYMENT
99.1/ 100
METRIC RATING
56th/ 347
METRIC RANK
6.9%
UNEMPLOYMENT
0.0/ 100
METRIC RATING
323rd/ 347
METRIC RANK
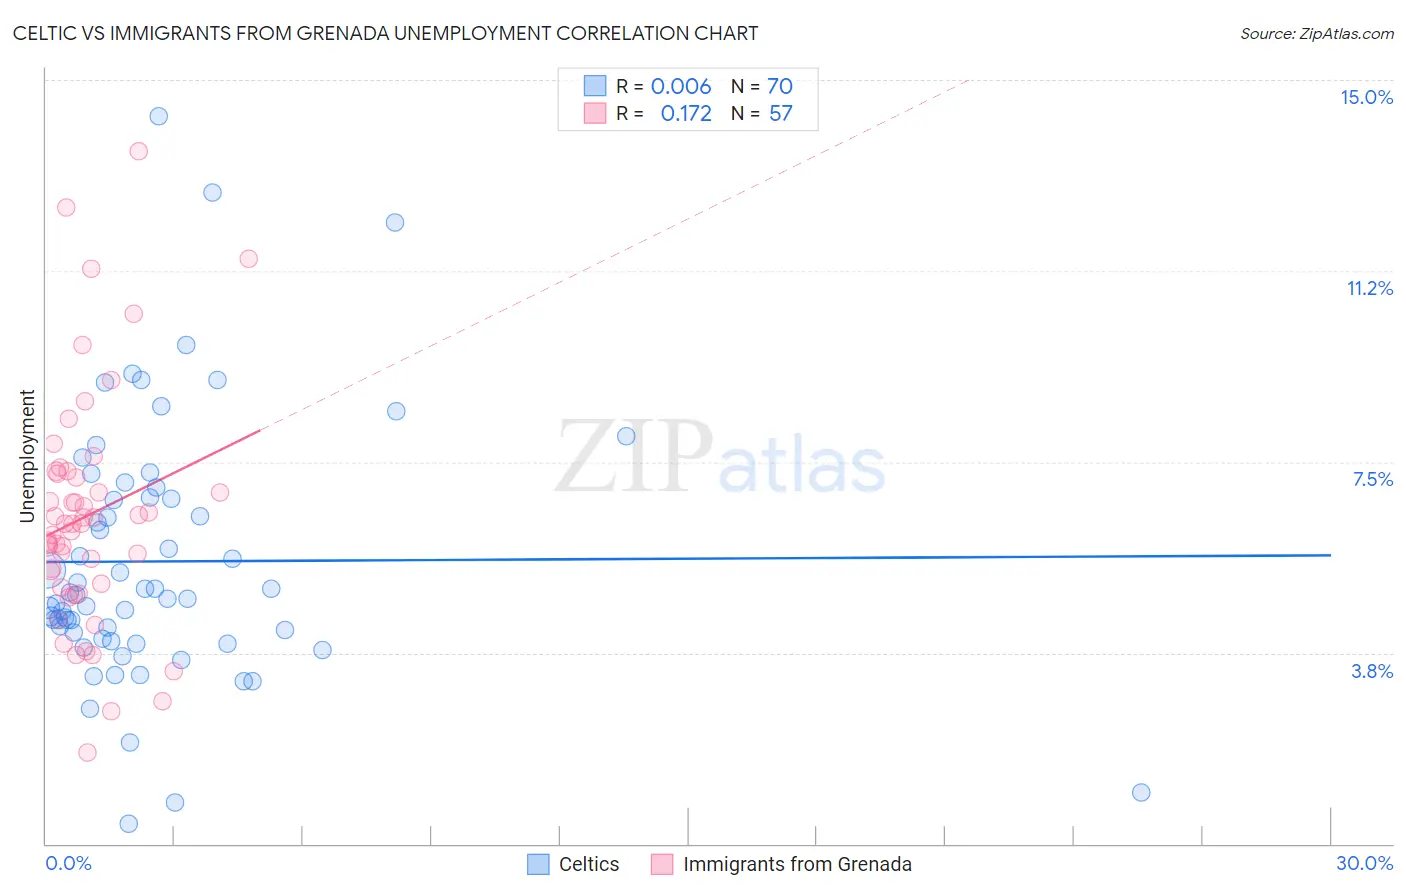
Celtic vs Immigrants from Grenada Unemployment Correlation Chart
The statistical analysis conducted on geographies consisting of 168,747,363 people shows no correlation between the proportion of Celtics and unemployment in the United States with a correlation coefficient (R) of 0.006 and weighted average of 4.9%. Similarly, the statistical analysis conducted on geographies consisting of 67,187,292 people shows a poor positive correlation between the proportion of Immigrants from Grenada and unemployment in the United States with a correlation coefficient (R) of 0.172 and weighted average of 6.9%, a difference of 41.7%.
Unemployment Correlation Summary
| Measurement | Celtic | Immigrants from Grenada |
| Minimum | 0.40% | 1.8% |
| Maximum | 14.3% | 13.6% |
| Range | 13.9% | 11.8% |
| Mean | 5.5% | 6.4% |
| Median | 4.8% | 6.3% |
| Interquartile 25% (IQ1) | 4.0% | 5.1% |
| Interquartile 75% (IQ3) | 6.8% | 7.3% |
| Interquartile Range (IQR) | 2.8% | 2.2% |
| Standard Deviation (Sample) | 2.6% | 2.3% |
| Standard Deviation (Population) | 2.6% | 2.3% |
Similar Demographics by Unemployment
Demographics Similar to Celtics by Unemployment
In terms of unemployment, the demographic groups most similar to Celtics are Immigrants from Singapore (4.9%, a difference of 0.070%), Australian (4.9%, a difference of 0.16%), Greek (4.9%, a difference of 0.17%), Eastern European (4.9%, a difference of 0.19%), and Bhutanese (4.9%, a difference of 0.20%).
| Demographics | Rating | Rank | Unemployment |
| Immigrants | South Central Asia | 99.3 /100 | #49 | Exceptional 4.9% |
| French Canadians | 99.3 /100 | #50 | Exceptional 4.9% |
| Immigrants | Belgium | 99.2 /100 | #51 | Exceptional 4.9% |
| Whites/Caucasians | 99.2 /100 | #52 | Exceptional 4.9% |
| Immigrants | Zimbabwe | 99.2 /100 | #53 | Exceptional 4.9% |
| Eastern Europeans | 99.2 /100 | #54 | Exceptional 4.9% |
| Australians | 99.2 /100 | #55 | Exceptional 4.9% |
| Celtics | 99.1 /100 | #56 | Exceptional 4.9% |
| Immigrants | Singapore | 99.1 /100 | #57 | Exceptional 4.9% |
| Greeks | 99.0 /100 | #58 | Exceptional 4.9% |
| Bhutanese | 99.0 /100 | #59 | Exceptional 4.9% |
| Immigrants | Netherlands | 99.0 /100 | #60 | Exceptional 4.9% |
| Cambodians | 99.0 /100 | #61 | Exceptional 4.9% |
| Icelanders | 98.9 /100 | #62 | Exceptional 4.9% |
| Immigrants | Bulgaria | 98.9 /100 | #63 | Exceptional 4.9% |
Demographics Similar to Immigrants from Grenada by Unemployment
In terms of unemployment, the demographic groups most similar to Immigrants from Grenada are Guyanese (6.9%, a difference of 0.32%), Immigrants from Guyana (6.9%, a difference of 0.36%), Immigrants from St. Vincent and the Grenadines (6.9%, a difference of 0.37%), Immigrants from Armenia (7.0%, a difference of 1.2%), and British West Indian (6.8%, a difference of 1.2%).
| Demographics | Rating | Rank | Unemployment |
| Immigrants | Dominica | 0.0 /100 | #316 | Tragic 6.7% |
| Shoshone | 0.0 /100 | #317 | Tragic 6.8% |
| Immigrants | Cabo Verde | 0.0 /100 | #318 | Tragic 6.8% |
| British West Indians | 0.0 /100 | #319 | Tragic 6.8% |
| Immigrants | St. Vincent and the Grenadines | 0.0 /100 | #320 | Tragic 6.9% |
| Immigrants | Guyana | 0.0 /100 | #321 | Tragic 6.9% |
| Guyanese | 0.0 /100 | #322 | Tragic 6.9% |
| Immigrants | Grenada | 0.0 /100 | #323 | Tragic 6.9% |
| Immigrants | Armenia | 0.0 /100 | #324 | Tragic 7.0% |
| Natives/Alaskans | 0.0 /100 | #325 | Tragic 7.0% |
| Paiute | 0.0 /100 | #326 | Tragic 7.1% |
| Pueblo | 0.0 /100 | #327 | Tragic 7.2% |
| Tsimshian | 0.0 /100 | #328 | Tragic 7.2% |
| Alaska Natives | 0.0 /100 | #329 | Tragic 7.2% |
| Yakama | 0.0 /100 | #330 | Tragic 7.3% |