Ukrainian vs Ottawa Unemployment
COMPARE
Ukrainian
Ottawa
Unemployment
Unemployment Comparison
Ukrainians
Ottawa
5.0%
UNEMPLOYMENT
96.0/ 100
METRIC RATING
93rd/ 347
METRIC RANK
5.5%
UNEMPLOYMENT
5.4/ 100
METRIC RATING
230th/ 347
METRIC RANK
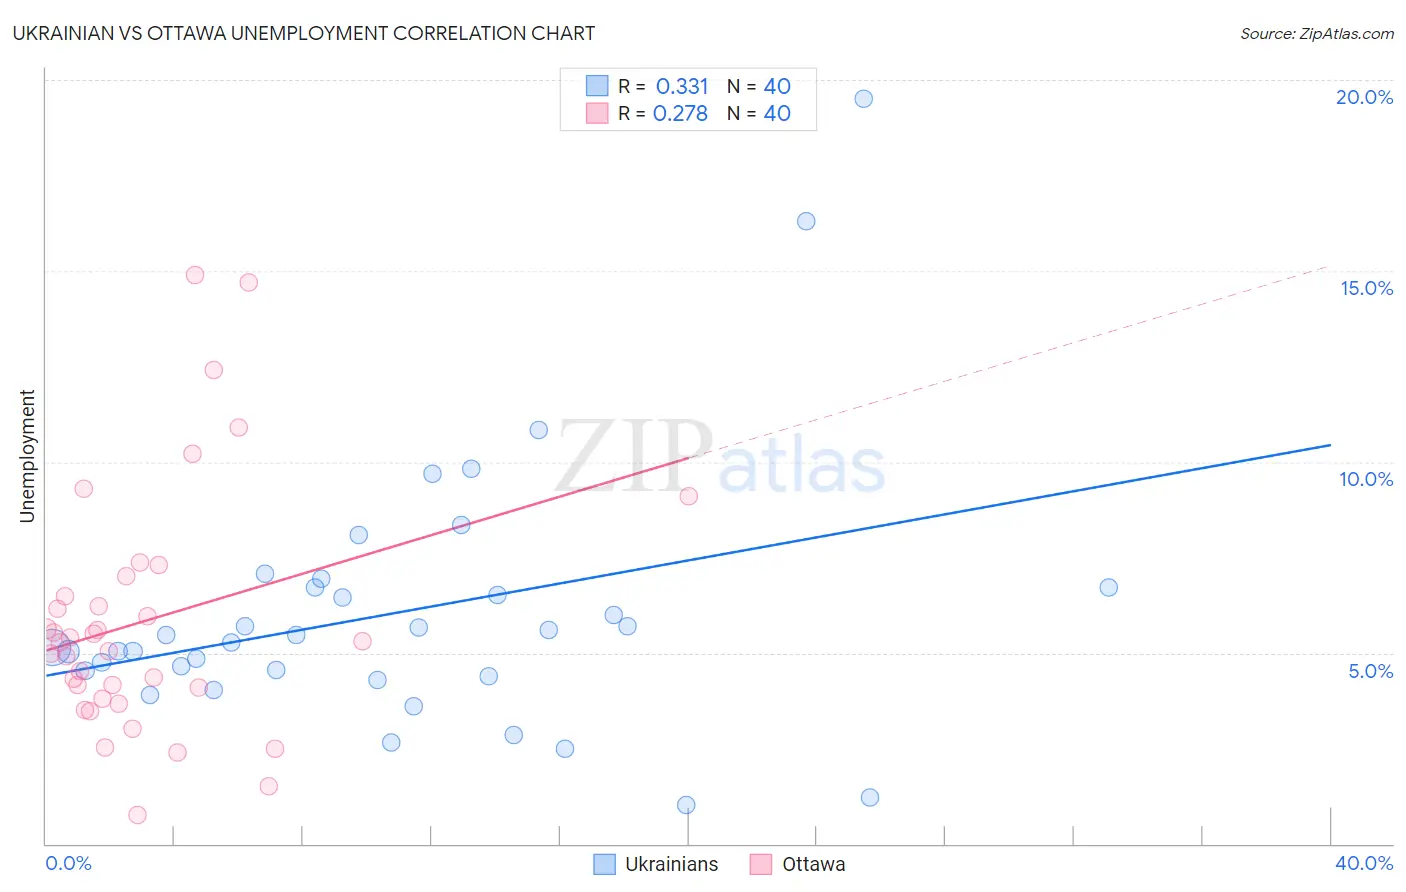
Ukrainian vs Ottawa Unemployment Correlation Chart
The statistical analysis conducted on geographies consisting of 447,775,950 people shows a mild positive correlation between the proportion of Ukrainians and unemployment in the United States with a correlation coefficient (R) of 0.331 and weighted average of 5.0%. Similarly, the statistical analysis conducted on geographies consisting of 49,942,125 people shows a weak positive correlation between the proportion of Ottawa and unemployment in the United States with a correlation coefficient (R) of 0.278 and weighted average of 5.5%, a difference of 9.8%.
Unemployment Correlation Summary
| Measurement | Ukrainian | Ottawa |
| Minimum | 1.0% | 0.77% |
| Maximum | 19.5% | 14.9% |
| Range | 18.5% | 14.1% |
| Mean | 6.0% | 5.8% |
| Median | 5.4% | 5.3% |
| Interquartile 25% (IQ1) | 4.5% | 4.0% |
| Interquartile 75% (IQ3) | 6.7% | 6.7% |
| Interquartile Range (IQR) | 2.2% | 2.8% |
| Standard Deviation (Sample) | 3.5% | 3.2% |
| Standard Deviation (Population) | 3.4% | 3.2% |
Similar Demographics by Unemployment
Demographics Similar to Ukrainians by Unemployment
In terms of unemployment, the demographic groups most similar to Ukrainians are Immigrants from Austria (5.0%, a difference of 0.030%), Immigrants from South Africa (5.0%, a difference of 0.090%), Immigrants from Sudan (5.0%, a difference of 0.11%), Immigrants from North Macedonia (5.0%, a difference of 0.12%), and Jordanian (5.0%, a difference of 0.16%).
| Demographics | Rating | Rank | Unemployment |
| Hungarians | 96.9 /100 | #86 | Exceptional 5.0% |
| Immigrants | Moldova | 96.6 /100 | #87 | Exceptional 5.0% |
| Immigrants | Korea | 96.6 /100 | #88 | Exceptional 5.0% |
| Jordanians | 96.4 /100 | #89 | Exceptional 5.0% |
| Immigrants | North Macedonia | 96.3 /100 | #90 | Exceptional 5.0% |
| Immigrants | Sudan | 96.3 /100 | #91 | Exceptional 5.0% |
| Immigrants | South Africa | 96.2 /100 | #92 | Exceptional 5.0% |
| Ukrainians | 96.0 /100 | #93 | Exceptional 5.0% |
| Immigrants | Austria | 95.9 /100 | #94 | Exceptional 5.0% |
| Immigrants | Serbia | 95.6 /100 | #95 | Exceptional 5.0% |
| Immigrants | England | 95.2 /100 | #96 | Exceptional 5.0% |
| Immigrants | Czechoslovakia | 95.1 /100 | #97 | Exceptional 5.0% |
| Romanians | 95.0 /100 | #98 | Exceptional 5.0% |
| Mongolians | 94.8 /100 | #99 | Exceptional 5.0% |
| Estonians | 94.6 /100 | #100 | Exceptional 5.0% |
Demographics Similar to Ottawa by Unemployment
In terms of unemployment, the demographic groups most similar to Ottawa are Hawaiian (5.5%, a difference of 0.0%), Immigrants from Africa (5.5%, a difference of 0.13%), Comanche (5.5%, a difference of 0.13%), Immigrants from Syria (5.5%, a difference of 0.18%), and Panamanian (5.5%, a difference of 0.21%).
| Demographics | Rating | Rank | Unemployment |
| Seminole | 9.2 /100 | #223 | Tragic 5.4% |
| Israelis | 8.8 /100 | #224 | Tragic 5.4% |
| South American Indians | 7.8 /100 | #225 | Tragic 5.5% |
| Samoans | 7.1 /100 | #226 | Tragic 5.5% |
| Immigrants | Lebanon | 7.0 /100 | #227 | Tragic 5.5% |
| Guamanians/Chamorros | 6.3 /100 | #228 | Tragic 5.5% |
| Hawaiians | 5.4 /100 | #229 | Tragic 5.5% |
| Ottawa | 5.4 /100 | #230 | Tragic 5.5% |
| Immigrants | Africa | 4.9 /100 | #231 | Tragic 5.5% |
| Comanche | 4.9 /100 | #232 | Tragic 5.5% |
| Immigrants | Syria | 4.8 /100 | #233 | Tragic 5.5% |
| Panamanians | 4.7 /100 | #234 | Tragic 5.5% |
| Immigrants | Panama | 3.4 /100 | #235 | Tragic 5.5% |
| Immigrants | Cambodia | 3.3 /100 | #236 | Tragic 5.5% |
| Moroccans | 3.2 /100 | #237 | Tragic 5.5% |