Pakistani vs Ottawa Unemployment

COMPARE

Pakistani
Race
Ancestry
AfghanAfricanAlaska NativeAlaskan AthabascanAlbanianAleutAlsatianAmericanApacheArabArapahoArgentineanArmenianAssyrian/Chaldean/SyriacAustralianAustrianBahamianBangladeshiBarbadianBasqueBelgianBelizeanBermudanBhutaneseBlackfeetBolivianBrazilianBritishBritish West IndianBulgarianBurmeseCajunCambodianCanadianCape VerdeanCarpatho RusynCelticCentral AmericanCentral American IndianCherokeeCheyenneChickasawChileanChineseChippewaChoctawColombianColvilleComancheCosta RicanCreeCreekCroatianCrowCubanCypriotCzechCzechoslovakianDanishDelawareDominicanDutchDutch West IndianEastern EuropeanEcuadorianEgyptianEnglishEstonianEthiopianEuropeanFijianFilipinoFinnishFrenchFrench American IndianFrench CanadianGermanGerman RussianGhanaianGreekGuamanian/ChamorroGuatemalanGuyaneseHaitianHmongHonduranHopiHoumaHungarianIcelanderIndian (Asian)IndonesianInupiatIranianIraqiIrishIroquoisIsraeliItalianJamaicanJapaneseJordanianKenyanKiowaKoreanLaotianLatvianLebaneseLiberianLithuanianLumbeeLuxembourgerMacedonianMalaysianMalteseMarshalleseMenomineeMexicanMexican American IndianMongolianMoroccanNative HawaiianNavajoNepaleseNew ZealanderNicaraguanNigerianNorthern EuropeanNorwegianOkinawanOsagePaiutePakistaniPalestinianPanamanianParaguayanPennsylvania GermanPeruvianPimaPolishPortuguesePotawatomiPuebloPuerto RicanPuget Sound SalishRomanianRussianSalvadoranSamoanScandinavianScotch-IrishScottishSeminoleSenegaleseSerbianShoshoneSierra LeoneanSiouxSlavicSlovakSloveneSomaliSouth AfricanSouth AmericanSouth American IndianSoviet UnionSpaniardSpanishSpanish AmericanSpanish American IndianSri LankanSubsaharan AfricanSudaneseSwedishSwissSyrianTaiwaneseThaiTlingit-HaidaTohono O'OdhamTonganTrinidadian and TobagonianTsimshianTurkishU.S. Virgin IslanderUgandanUkrainianUruguayanUteVenezuelanVietnameseWelshWest IndianYakamaYaquiYugoslavianYumanYup'ikZimbabwean
Immigration
NonimmigrantsImmigrantsAfghanistanAfricaAlbaniaArgentinaArmeniaAsiaAustraliaAustriaBahamasBangladeshBarbadosBelarusBelgiumBelizeBoliviaBosnia and HerzegovinaBrazilBulgariaBurma/MyanmarCabo VerdeCambodiaCameroonCanadaCaribbeanCentral AmericaChileChinaColombiaCongoCosta RicaCroatiaCubaCzechoslovakiaDenmarkDominicaDominican RepublicEastern AfricaEastern AsiaEastern EuropeEcuadorEgyptEl SalvadorEnglandEritreaEthiopiaEuropeFijiFranceGermanyGhanaGreeceGrenadaGuatemalaGuyanaHaitiHondurasHong KongHungaryIndiaIndonesiaIranIraqIrelandIsraelItalyJamaicaJapanJordanKazakhstanKenyaKoreaKuwaitLaosLatin AmericaLatviaLebanonLiberiaLithuaniaMalaysiaMexicoMicronesiaMiddle AfricaMoldovaMoroccoNepalNetherlandsNicaraguaNigeriaNorth AmericaNorth MacedoniaNorthern AfricaNorthern EuropeNorwayOceaniaPakistanPanamaPeruPhilippinesPolandPortugalRomaniaRussiaSaudi ArabiaScotlandSenegalSerbiaSierra LeoneSingaporeSomaliaSouth AfricaSouth AmericaSouth Central AsiaSouth Eastern AsiaSouthern EuropeSpainSri LankaSt. Vincent and the GrenadinesSudanSwedenSwitzerlandSyriaTaiwanThailandTrinidad and TobagoTurkeyUgandaUkraineUruguayUzbekistanVenezuelaVietnamWest IndiesWestern AfricaWestern AsiaWestern EuropeYemenZaireZimbabweAzores
Ottawa
Race
Ancestry
AfghanAfricanAlaska NativeAlaskan AthabascanAlbanianAleutAlsatianAmericanApacheArabArapahoArgentineanArmenianAssyrian/Chaldean/SyriacAustralianAustrianBahamianBangladeshiBarbadianBasqueBelgianBelizeanBermudanBhutaneseBlackfeetBolivianBrazilianBritishBritish West IndianBulgarianBurmeseCajunCambodianCanadianCape VerdeanCarpatho RusynCelticCentral AmericanCentral American IndianCherokeeCheyenneChickasawChileanChineseChippewaChoctawColombianColvilleComancheCosta RicanCreeCreekCroatianCrowCubanCypriotCzechCzechoslovakianDanishDelawareDominicanDutchDutch West IndianEastern EuropeanEcuadorianEgyptianEnglishEstonianEthiopianEuropeanFijianFilipinoFinnishFrenchFrench American IndianFrench CanadianGermanGerman RussianGhanaianGreekGuamanian/ChamorroGuatemalanGuyaneseHaitianHmongHonduranHopiHoumaHungarianIcelanderIndian (Asian)IndonesianInupiatIranianIraqiIrishIroquoisIsraeliItalianJamaicanJapaneseJordanianKenyanKiowaKoreanLaotianLatvianLebaneseLiberianLithuanianLumbeeLuxembourgerMacedonianMalaysianMalteseMarshalleseMenomineeMexicanMexican American IndianMongolianMoroccanNative HawaiianNavajoNepaleseNew ZealanderNicaraguanNigerianNorthern EuropeanNorwegianOkinawanOsageOttawaPaiutePalestinianPanamanianParaguayanPennsylvania GermanPeruvianPimaPolishPortuguesePotawatomiPuebloPuerto RicanPuget Sound SalishRomanianRussianSalvadoranSamoanScandinavianScotch-IrishScottishSeminoleSenegaleseSerbianShoshoneSierra LeoneanSiouxSlavicSlovakSloveneSomaliSouth AfricanSouth AmericanSouth American IndianSoviet UnionSpaniardSpanishSpanish AmericanSpanish American IndianSri LankanSubsaharan AfricanSudaneseSwedishSwissSyrianTaiwaneseThaiTlingit-HaidaTohono O'OdhamTonganTrinidadian and TobagonianTsimshianTurkishU.S. Virgin IslanderUgandanUkrainianUruguayanUteVenezuelanVietnameseWelshWest IndianYakamaYaquiYugoslavianYumanYup'ikZimbabwean
Immigration
NonimmigrantsImmigrantsAfghanistanAfricaAlbaniaArgentinaArmeniaAsiaAustraliaAustriaBahamasBangladeshBarbadosBelarusBelgiumBelizeBoliviaBosnia and HerzegovinaBrazilBulgariaBurma/MyanmarCabo VerdeCambodiaCameroonCanadaCaribbeanCentral AmericaChileChinaColombiaCongoCosta RicaCroatiaCubaCzechoslovakiaDenmarkDominicaDominican RepublicEastern AfricaEastern AsiaEastern EuropeEcuadorEgyptEl SalvadorEnglandEritreaEthiopiaEuropeFijiFranceGermanyGhanaGreeceGrenadaGuatemalaGuyanaHaitiHondurasHong KongHungaryIndiaIndonesiaIranIraqIrelandIsraelItalyJamaicaJapanJordanKazakhstanKenyaKoreaKuwaitLaosLatin AmericaLatviaLebanonLiberiaLithuaniaMalaysiaMexicoMicronesiaMiddle AfricaMoldovaMoroccoNepalNetherlandsNicaraguaNigeriaNorth AmericaNorth MacedoniaNorthern AfricaNorthern EuropeNorwayOceaniaPakistanPanamaPeruPhilippinesPolandPortugalRomaniaRussiaSaudi ArabiaScotlandSenegalSerbiaSierra LeoneSingaporeSomaliaSouth AfricaSouth AmericaSouth Central AsiaSouth Eastern AsiaSouthern EuropeSpainSri LankaSt. Vincent and the GrenadinesSudanSwedenSwitzerlandSyriaTaiwanThailandTrinidad and TobagoTurkeyUgandaUkraineUruguayUzbekistanVenezuelaVietnamWest IndiesWestern AfricaWestern AsiaWestern EuropeYemenZaireZimbabweAzores
Unemployment
Income
Poverty
Unemployment
Labor Participation
Family Structure
Vehicle Availability
Education Level
Disability

Unemployment Comparison

Pakistanis

Ottawa

Excellent
Tragic
5.1%
UNEMPLOYMENT
85.3/ 100
METRIC RATING
139th/ 347
METRIC RANK
5.5%
UNEMPLOYMENT
5.4/ 100
METRIC RATING
230th/ 347
METRIC RANK

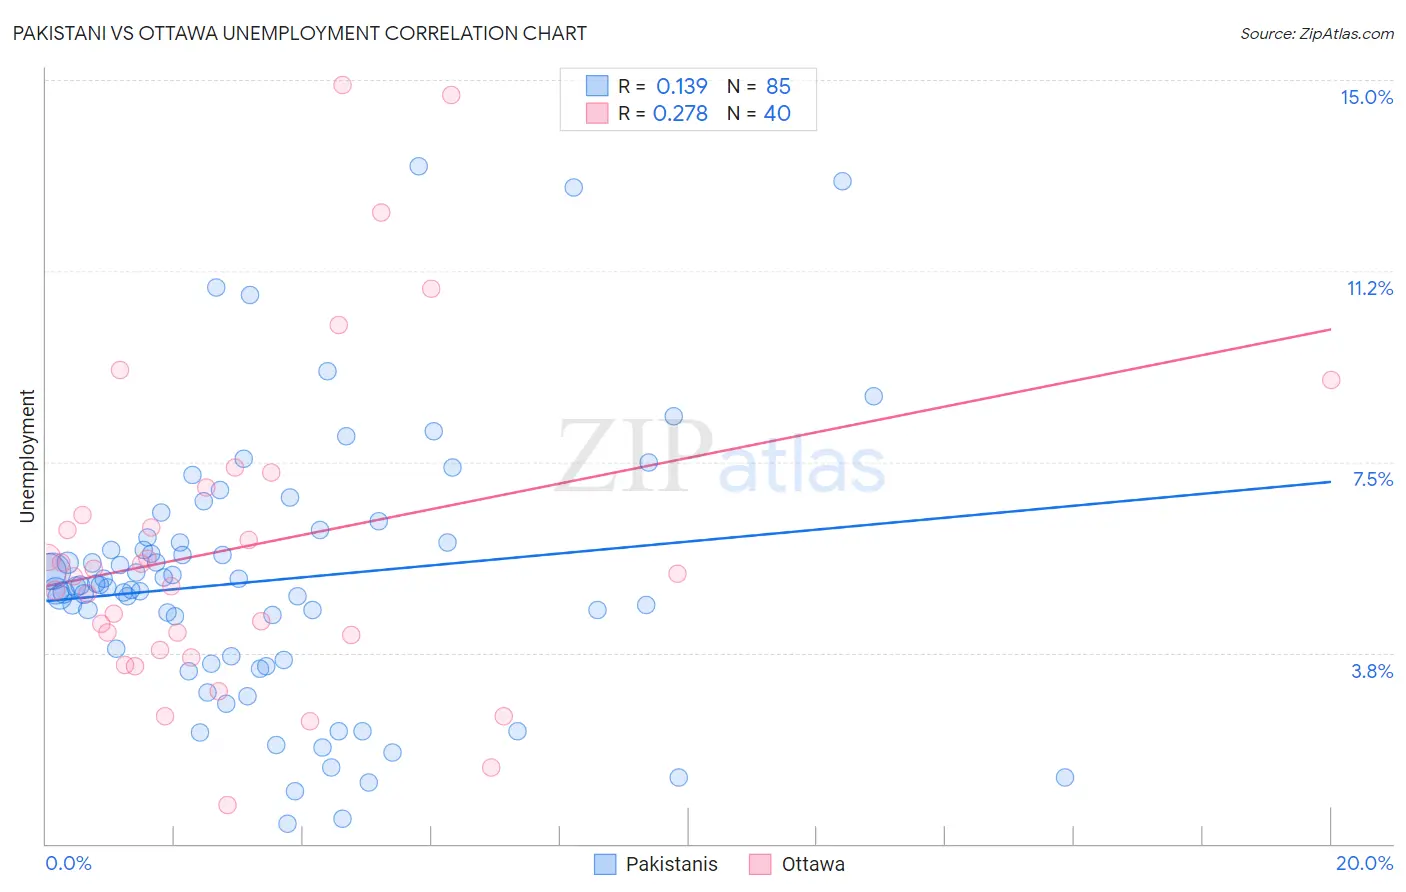
Pakistani vs Ottawa Unemployment Correlation Chart

The statistical analysis conducted on geographies consisting of 335,152,047 people shows a poor positive correlation between the proportion of Pakistanis and unemployment in the United States with a correlation coefficient (R) of 0.139 and weighted average of 5.1%. Similarly, the statistical analysis conducted on geographies consisting of 49,942,125 people shows a weak positive correlation between the proportion of Ottawa and unemployment in the United States with a correlation coefficient (R) of 0.278 and weighted average of 5.5%, a difference of 7.3%.
Pakistani vs Ottawa Unemployment

Unemployment Correlation Summary

MeasurementPakistaniOttawa
Minimum0.40%0.77%
Maximum13.3%14.9%
Range12.9%14.1%
Mean5.2%5.8%
Median5.0%5.3%
Interquartile 25% (IQ1)3.6%4.0%
Interquartile 75% (IQ3)6.0%6.7%
Interquartile Range (IQR)2.4%2.8%
Standard Deviation (Sample)2.6%3.2%
Standard Deviation (Population)2.6%3.2%

Similar Demographics by Unemployment

Demographics Similar to Pakistanis by Unemployment

In terms of unemployment, the demographic groups most similar to Pakistanis are Immigrants from Saudi Arabia (5.1%, a difference of 0.040%), Immigrants from Hungary (5.1%, a difference of 0.040%), Immigrants from Burma/Myanmar (5.1%, a difference of 0.12%), Immigrants from Spain (5.1%, a difference of 0.12%), and Immigrants from Europe (5.1%, a difference of 0.13%).
DemographicsRating | RankUnemployment
Immigrants | Ethiopia
86.7
/100
|
#132
Excellent
5.1%
Immigrants | Jordan
86.6
/100
|
#133
Excellent
5.1%
Immigrants | Europe
86.3
/100
|
#134
Excellent
5.1%
Immigrants | Burma/Myanmar
86.2
/100
|
#135
Excellent
5.1%
Immigrants | Spain
86.2
/100
|
#136
Excellent
5.1%
Immigrants | Saudi Arabia
85.6
/100
|
#137
Excellent
5.1%
Immigrants | Hungary
85.6
/100
|
#138
Excellent
5.1%
Pakistanis
85.3
/100
|
#139
Excellent
5.1%
Immigrants | Denmark
84.3
/100
|
#140
Excellent
5.1%
Palestinians
83.4
/100
|
#141
Excellent
5.1%
Immigrants | Pakistan
83.2
/100
|
#142
Excellent
5.1%
Immigrants | Chile
82.8
/100
|
#143
Excellent
5.1%
Indonesians
82.3
/100
|
#144
Excellent
5.1%
Immigrants | Norway
81.8
/100
|
#145
Excellent
5.1%
Immigrants | Asia
81.8
/100
|
#146
Excellent
5.1%

Demographics Similar to Ottawa by Unemployment

In terms of unemployment, the demographic groups most similar to Ottawa are Hawaiian (5.5%, a difference of 0.0%), Immigrants from Africa (5.5%, a difference of 0.13%), Comanche (5.5%, a difference of 0.13%), Immigrants from Syria (5.5%, a difference of 0.18%), and Panamanian (5.5%, a difference of 0.21%).
DemographicsRating | RankUnemployment
Seminole
9.2
/100
|
#223
Tragic
5.4%
Israelis
8.8
/100
|
#224
Tragic
5.4%
South American Indians
7.8
/100
|
#225
Tragic
5.5%
Samoans
7.1
/100
|
#226
Tragic
5.5%
Immigrants | Lebanon
7.0
/100
|
#227
Tragic
5.5%
Guamanians/Chamorros
6.3
/100
|
#228
Tragic
5.5%
Hawaiians
5.4
/100
|
#229
Tragic
5.5%
Ottawa
5.4
/100
|
#230
Tragic
5.5%
Immigrants | Africa
4.9
/100
|
#231
Tragic
5.5%
Comanche
4.9
/100
|
#232
Tragic
5.5%
Immigrants | Syria
4.8
/100
|
#233
Tragic
5.5%
Panamanians
4.7
/100
|
#234
Tragic
5.5%
Immigrants | Panama
3.4
/100
|
#235
Tragic
5.5%
Immigrants | Cambodia
3.3
/100
|
#236
Tragic
5.5%
Moroccans
3.2
/100
|
#237
Tragic
5.5%