Celtic vs Tongan Unemployment
COMPARE
Celtic
Tongan
Unemployment
Unemployment Comparison
Celtics
Tongans
4.9%
UNEMPLOYMENT
99.1/ 100
METRIC RATING
56th/ 347
METRIC RANK
4.8%
UNEMPLOYMENT
99.7/ 100
METRIC RATING
36th/ 347
METRIC RANK
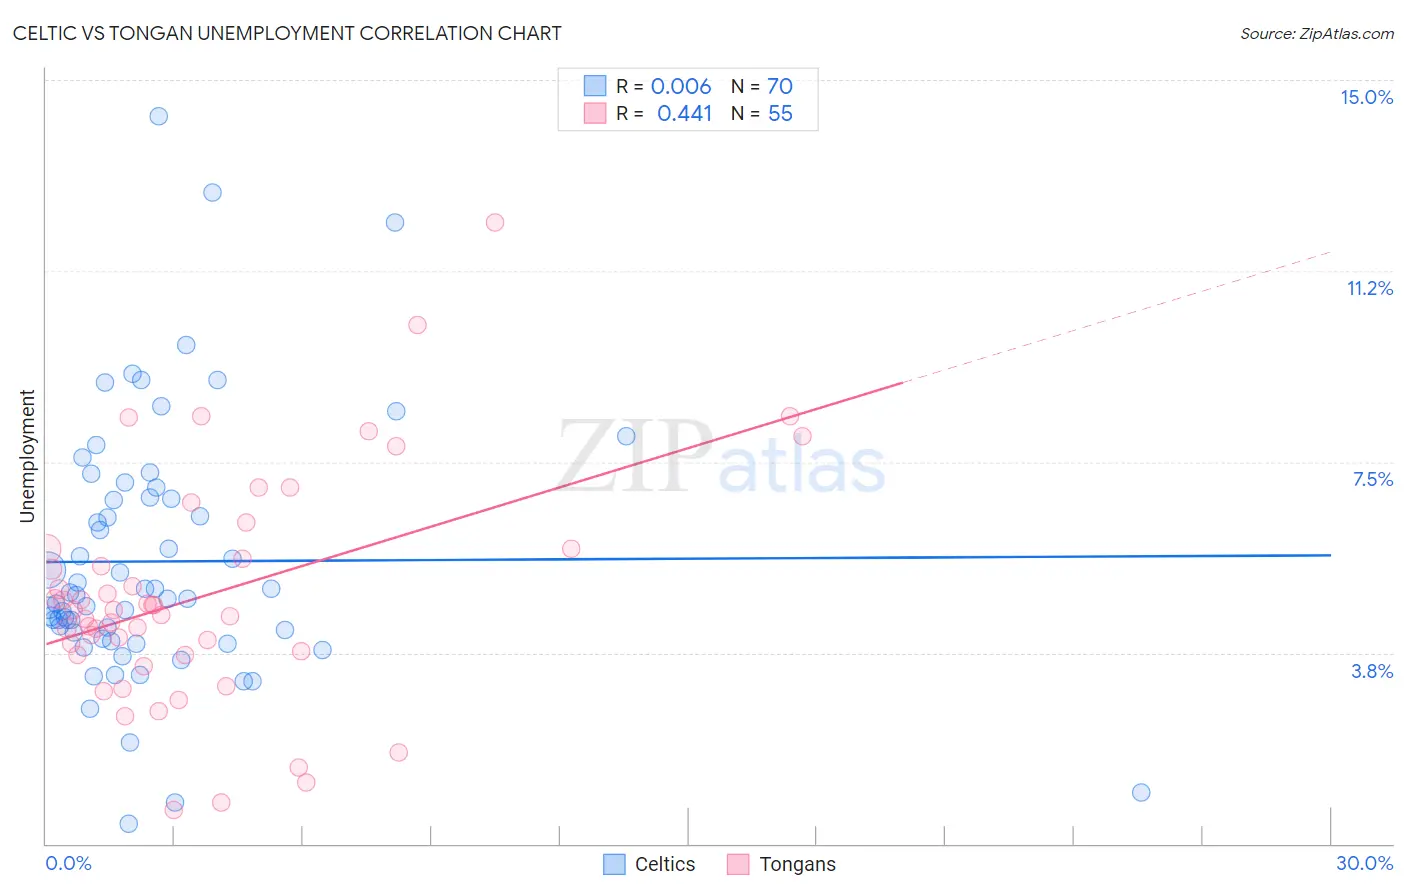
Celtic vs Tongan Unemployment Correlation Chart
The statistical analysis conducted on geographies consisting of 168,747,363 people shows no correlation between the proportion of Celtics and unemployment in the United States with a correlation coefficient (R) of 0.006 and weighted average of 4.9%. Similarly, the statistical analysis conducted on geographies consisting of 102,862,853 people shows a moderate positive correlation between the proportion of Tongans and unemployment in the United States with a correlation coefficient (R) of 0.441 and weighted average of 4.8%, a difference of 2.1%.
Unemployment Correlation Summary
| Measurement | Celtic | Tongan |
| Minimum | 0.40% | 0.66% |
| Maximum | 14.3% | 12.2% |
| Range | 13.9% | 11.5% |
| Mean | 5.5% | 4.9% |
| Median | 4.8% | 4.6% |
| Interquartile 25% (IQ1) | 4.0% | 3.7% |
| Interquartile 75% (IQ3) | 6.8% | 5.8% |
| Interquartile Range (IQR) | 2.8% | 2.1% |
| Standard Deviation (Sample) | 2.6% | 2.2% |
| Standard Deviation (Population) | 2.6% | 2.2% |
Demographics Similar to Celtics and Tongans by Unemployment
In terms of unemployment, the demographic groups most similar to Celtics are Australian (4.9%, a difference of 0.16%), Eastern European (4.9%, a difference of 0.19%), Immigrants from Zimbabwe (4.9%, a difference of 0.22%), White/Caucasian (4.9%, a difference of 0.25%), and Immigrants from Belgium (4.9%, a difference of 0.26%). Similarly, the demographic groups most similar to Tongans are Czechoslovakian (4.8%, a difference of 0.070%), Bolivian (4.8%, a difference of 0.26%), Lithuanian (4.8%, a difference of 0.41%), Northern European (4.8%, a difference of 0.42%), and Immigrants from Bosnia and Herzegovina (4.8%, a difference of 0.45%).
| Demographics | Rating | Rank | Unemployment |
| Tongans | 99.7 /100 | #36 | Exceptional 4.8% |
| Czechoslovakians | 99.7 /100 | #37 | Exceptional 4.8% |
| Bolivians | 99.7 /100 | #38 | Exceptional 4.8% |
| Lithuanians | 99.7 /100 | #39 | Exceptional 4.8% |
| Northern Europeans | 99.7 /100 | #40 | Exceptional 4.8% |
| Immigrants | Bosnia and Herzegovina | 99.7 /100 | #41 | Exceptional 4.8% |
| Filipinos | 99.5 /100 | #42 | Exceptional 4.8% |
| Yugoslavians | 99.5 /100 | #43 | Exceptional 4.8% |
| Austrians | 99.5 /100 | #44 | Exceptional 4.8% |
| French | 99.5 /100 | #45 | Exceptional 4.8% |
| Immigrants | Nepal | 99.4 /100 | #46 | Exceptional 4.8% |
| Immigrants | Taiwan | 99.4 /100 | #47 | Exceptional 4.8% |
| Immigrants | Scotland | 99.3 /100 | #48 | Exceptional 4.9% |
| Immigrants | South Central Asia | 99.3 /100 | #49 | Exceptional 4.9% |
| French Canadians | 99.3 /100 | #50 | Exceptional 4.9% |
| Immigrants | Belgium | 99.2 /100 | #51 | Exceptional 4.9% |
| Whites/Caucasians | 99.2 /100 | #52 | Exceptional 4.9% |
| Immigrants | Zimbabwe | 99.2 /100 | #53 | Exceptional 4.9% |
| Eastern Europeans | 99.2 /100 | #54 | Exceptional 4.9% |
| Australians | 99.2 /100 | #55 | Exceptional 4.9% |
| Celtics | 99.1 /100 | #56 | Exceptional 4.9% |