Celtic vs Ottawa In Labor Force | Age 35-44
COMPARE
Celtic
Ottawa
In Labor Force | Age 35-44
In Labor Force | Age 35-44 Comparison
Celtics
Ottawa
83.8%
IN LABOR FORCE | AGE 35-44
1.4/ 100
METRIC RATING
239th/ 347
METRIC RANK
82.6%
IN LABOR FORCE | AGE 35-44
0.0/ 100
METRIC RATING
298th/ 347
METRIC RANK
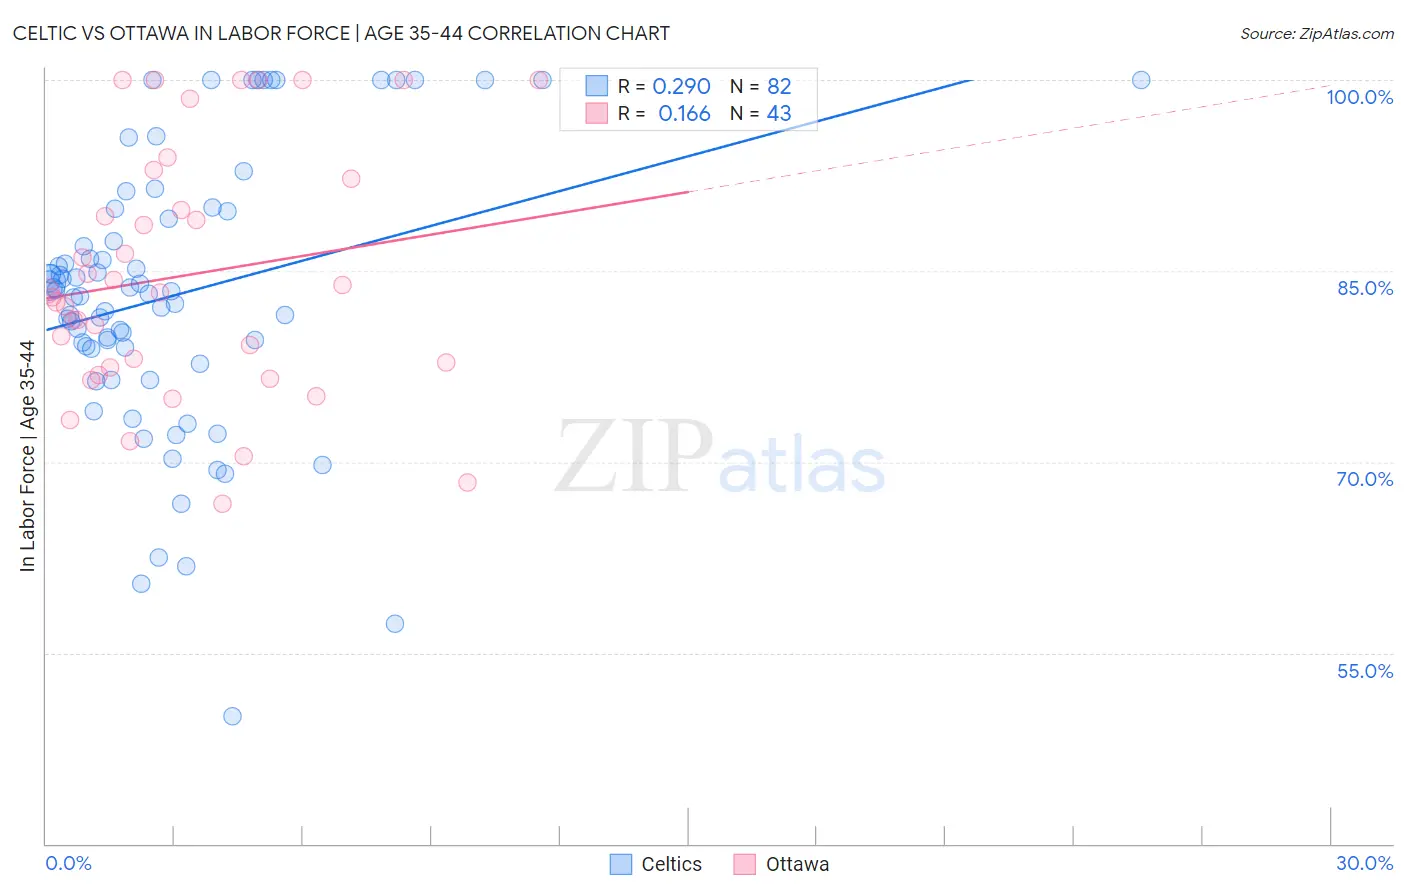
Celtic vs Ottawa In Labor Force | Age 35-44 Correlation Chart
The statistical analysis conducted on geographies consisting of 168,864,991 people shows a weak positive correlation between the proportion of Celtics and labor force participation rate among population between the ages 35 and 44 in the United States with a correlation coefficient (R) of 0.290 and weighted average of 83.8%. Similarly, the statistical analysis conducted on geographies consisting of 49,950,273 people shows a poor positive correlation between the proportion of Ottawa and labor force participation rate among population between the ages 35 and 44 in the United States with a correlation coefficient (R) of 0.166 and weighted average of 82.6%, a difference of 1.5%.
In Labor Force | Age 35-44 Correlation Summary
| Measurement | Celtic | Ottawa |
| Minimum | 50.0% | 66.7% |
| Maximum | 100.0% | 100.0% |
| Range | 50.0% | 33.3% |
| Mean | 83.1% | 84.6% |
| Median | 83.3% | 83.3% |
| Interquartile 25% (IQ1) | 78.9% | 77.4% |
| Interquartile 75% (IQ3) | 89.7% | 92.2% |
| Interquartile Range (IQR) | 10.9% | 14.8% |
| Standard Deviation (Sample) | 10.9% | 9.6% |
| Standard Deviation (Population) | 10.8% | 9.5% |
Similar Demographics by In Labor Force | Age 35-44
Demographics Similar to Celtics by In Labor Force | Age 35-44
In terms of in labor force | age 35-44, the demographic groups most similar to Celtics are Arab (83.8%, a difference of 0.0%), Iraqi (83.8%, a difference of 0.010%), Immigrants from Laos (83.8%, a difference of 0.030%), Immigrants from Cambodia (83.8%, a difference of 0.030%), and Immigrants from Western Asia (83.8%, a difference of 0.030%).
| Demographics | Rating | Rank | In Labor Force | Age 35-44 |
| Native Hawaiians | 3.0 /100 | #232 | Tragic 83.9% |
| Immigrants | Germany | 2.8 /100 | #233 | Tragic 83.9% |
| Immigrants | Oceania | 2.6 /100 | #234 | Tragic 83.9% |
| Immigrants | Syria | 2.5 /100 | #235 | Tragic 83.9% |
| West Indians | 2.4 /100 | #236 | Tragic 83.9% |
| English | 1.8 /100 | #237 | Tragic 83.8% |
| Immigrants | Laos | 1.7 /100 | #238 | Tragic 83.8% |
| Celtics | 1.4 /100 | #239 | Tragic 83.8% |
| Arabs | 1.3 /100 | #240 | Tragic 83.8% |
| Iraqis | 1.3 /100 | #241 | Tragic 83.8% |
| Immigrants | Cambodia | 1.1 /100 | #242 | Tragic 83.8% |
| Immigrants | Western Asia | 1.1 /100 | #243 | Tragic 83.8% |
| Guyanese | 1.1 /100 | #244 | Tragic 83.8% |
| Malaysians | 1.1 /100 | #245 | Tragic 83.8% |
| Immigrants | Immigrants | 1.0 /100 | #246 | Tragic 83.7% |
Demographics Similar to Ottawa by In Labor Force | Age 35-44
In terms of in labor force | age 35-44, the demographic groups most similar to Ottawa are Tlingit-Haida (82.5%, a difference of 0.010%), Mexican American Indian (82.6%, a difference of 0.020%), Hmong (82.6%, a difference of 0.020%), Central American Indian (82.5%, a difference of 0.080%), and Spanish American Indian (82.5%, a difference of 0.10%).
| Demographics | Rating | Rank | In Labor Force | Age 35-44 |
| Pennsylvania Germans | 0.0 /100 | #291 | Tragic 82.9% |
| Immigrants | Latin America | 0.0 /100 | #292 | Tragic 82.8% |
| Spanish Americans | 0.0 /100 | #293 | Tragic 82.8% |
| Potawatomi | 0.0 /100 | #294 | Tragic 82.7% |
| Immigrants | Lebanon | 0.0 /100 | #295 | Tragic 82.7% |
| Mexican American Indians | 0.0 /100 | #296 | Tragic 82.6% |
| Hmong | 0.0 /100 | #297 | Tragic 82.6% |
| Ottawa | 0.0 /100 | #298 | Tragic 82.6% |
| Tlingit-Haida | 0.0 /100 | #299 | Tragic 82.5% |
| Central American Indians | 0.0 /100 | #300 | Tragic 82.5% |
| Spanish American Indians | 0.0 /100 | #301 | Tragic 82.5% |
| Americans | 0.0 /100 | #302 | Tragic 82.4% |
| Nepalese | 0.0 /100 | #303 | Tragic 82.4% |
| Marshallese | 0.0 /100 | #304 | Tragic 82.4% |
| Shoshone | 0.0 /100 | #305 | Tragic 82.2% |