Creek vs Ottawa Unemployment
COMPARE
Creek
Ottawa
Unemployment
Unemployment Comparison
Creek
Ottawa
5.4%
UNEMPLOYMENT
19.4/ 100
METRIC RATING
207th/ 347
METRIC RANK
5.5%
UNEMPLOYMENT
5.4/ 100
METRIC RATING
230th/ 347
METRIC RANK
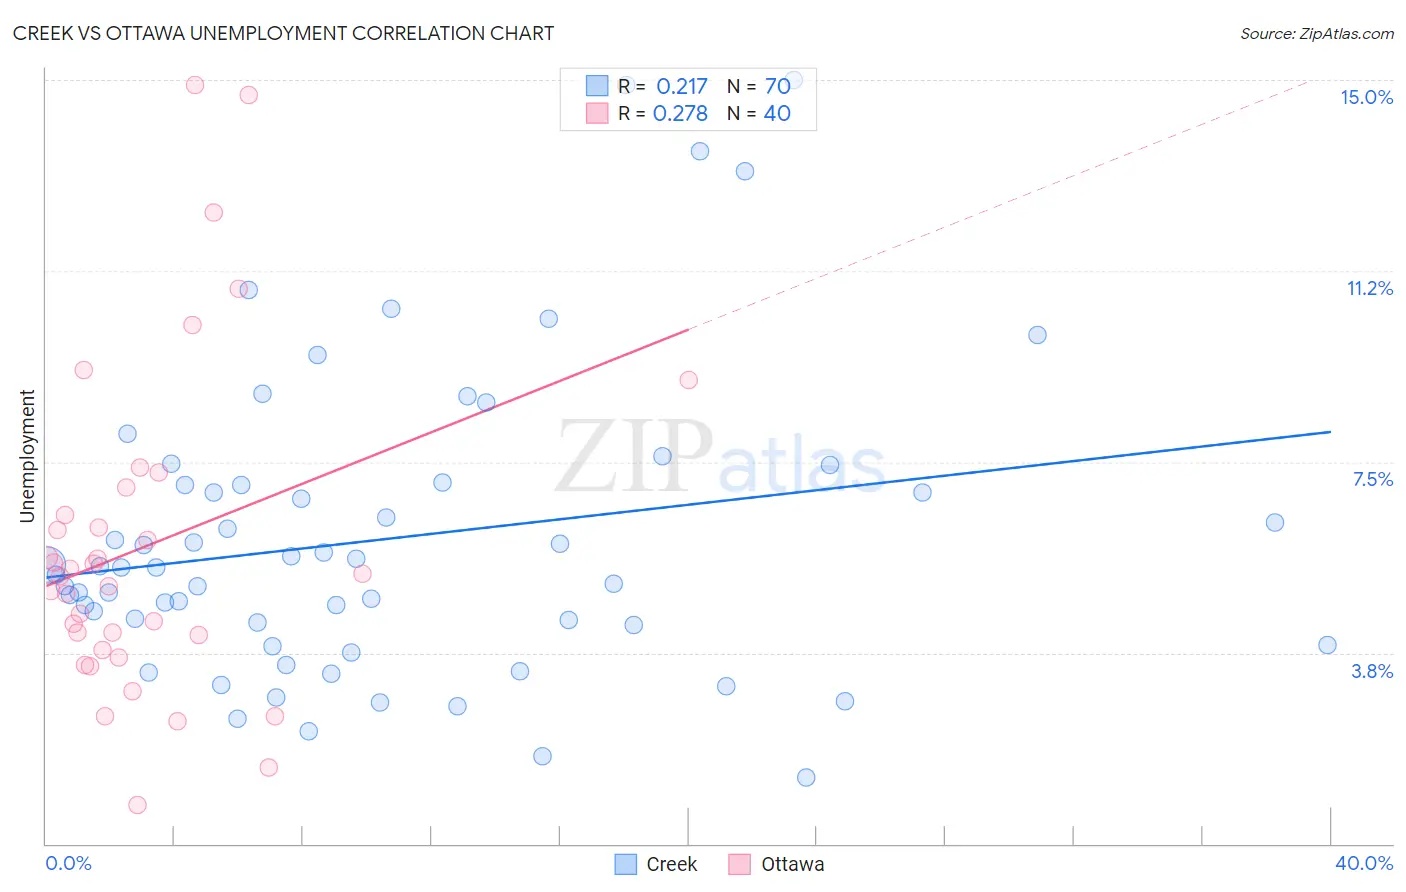
Creek vs Ottawa Unemployment Correlation Chart
The statistical analysis conducted on geographies consisting of 178,280,208 people shows a weak positive correlation between the proportion of Creek and unemployment in the United States with a correlation coefficient (R) of 0.217 and weighted average of 5.4%. Similarly, the statistical analysis conducted on geographies consisting of 49,942,125 people shows a weak positive correlation between the proportion of Ottawa and unemployment in the United States with a correlation coefficient (R) of 0.278 and weighted average of 5.5%, a difference of 2.2%.
Unemployment Correlation Summary
| Measurement | Creek | Ottawa |
| Minimum | 1.3% | 0.77% |
| Maximum | 15.0% | 14.9% |
| Range | 13.7% | 14.1% |
| Mean | 6.0% | 5.8% |
| Median | 5.4% | 5.3% |
| Interquartile 25% (IQ1) | 4.3% | 4.0% |
| Interquartile 75% (IQ3) | 7.1% | 6.7% |
| Interquartile Range (IQR) | 2.8% | 2.8% |
| Standard Deviation (Sample) | 2.9% | 3.2% |
| Standard Deviation (Population) | 2.9% | 3.2% |
Similar Demographics by Unemployment
Demographics Similar to Creek by Unemployment
In terms of unemployment, the demographic groups most similar to Creek are Portuguese (5.4%, a difference of 0.030%), Immigrants from Iran (5.4%, a difference of 0.060%), Immigrants from Iraq (5.4%, a difference of 0.080%), Iraqi (5.4%, a difference of 0.13%), and Ugandan (5.4%, a difference of 0.14%).
| Demographics | Rating | Rank | Unemployment |
| Koreans | 27.4 /100 | #200 | Fair 5.3% |
| Immigrants | South Eastern Asia | 27.0 /100 | #201 | Fair 5.3% |
| Cherokee | 25.5 /100 | #202 | Fair 5.3% |
| Immigrants | Micronesia | 25.2 /100 | #203 | Fair 5.3% |
| Immigrants | Ukraine | 24.9 /100 | #204 | Fair 5.3% |
| Native Hawaiians | 24.1 /100 | #205 | Fair 5.3% |
| Immigrants | Peru | 22.7 /100 | #206 | Fair 5.4% |
| Creek | 19.4 /100 | #207 | Poor 5.4% |
| Portuguese | 19.0 /100 | #208 | Poor 5.4% |
| Immigrants | Iran | 18.8 /100 | #209 | Poor 5.4% |
| Immigrants | Iraq | 18.6 /100 | #210 | Poor 5.4% |
| Iraqis | 18.1 /100 | #211 | Poor 5.4% |
| Ugandans | 18.0 /100 | #212 | Poor 5.4% |
| Immigrants | Middle Africa | 15.3 /100 | #213 | Poor 5.4% |
| Immigrants | Costa Rica | 15.2 /100 | #214 | Poor 5.4% |
Demographics Similar to Ottawa by Unemployment
In terms of unemployment, the demographic groups most similar to Ottawa are Hawaiian (5.5%, a difference of 0.0%), Immigrants from Africa (5.5%, a difference of 0.13%), Comanche (5.5%, a difference of 0.13%), Immigrants from Syria (5.5%, a difference of 0.18%), and Panamanian (5.5%, a difference of 0.21%).
| Demographics | Rating | Rank | Unemployment |
| Seminole | 9.2 /100 | #223 | Tragic 5.4% |
| Israelis | 8.8 /100 | #224 | Tragic 5.4% |
| South American Indians | 7.8 /100 | #225 | Tragic 5.5% |
| Samoans | 7.1 /100 | #226 | Tragic 5.5% |
| Immigrants | Lebanon | 7.0 /100 | #227 | Tragic 5.5% |
| Guamanians/Chamorros | 6.3 /100 | #228 | Tragic 5.5% |
| Hawaiians | 5.4 /100 | #229 | Tragic 5.5% |
| Ottawa | 5.4 /100 | #230 | Tragic 5.5% |
| Immigrants | Africa | 4.9 /100 | #231 | Tragic 5.5% |
| Comanche | 4.9 /100 | #232 | Tragic 5.5% |
| Immigrants | Syria | 4.8 /100 | #233 | Tragic 5.5% |
| Panamanians | 4.7 /100 | #234 | Tragic 5.5% |
| Immigrants | Panama | 3.4 /100 | #235 | Tragic 5.5% |
| Immigrants | Cambodia | 3.3 /100 | #236 | Tragic 5.5% |
| Moroccans | 3.2 /100 | #237 | Tragic 5.5% |