Celtic vs Immigrants from Kazakhstan Unemployment
COMPARE
Celtic
Immigrants from Kazakhstan
Unemployment
Unemployment Comparison
Celtics
Immigrants from Kazakhstan
4.9%
UNEMPLOYMENT
99.1/ 100
METRIC RATING
56th/ 347
METRIC RANK
5.2%
UNEMPLOYMENT
70.4/ 100
METRIC RATING
156th/ 347
METRIC RANK
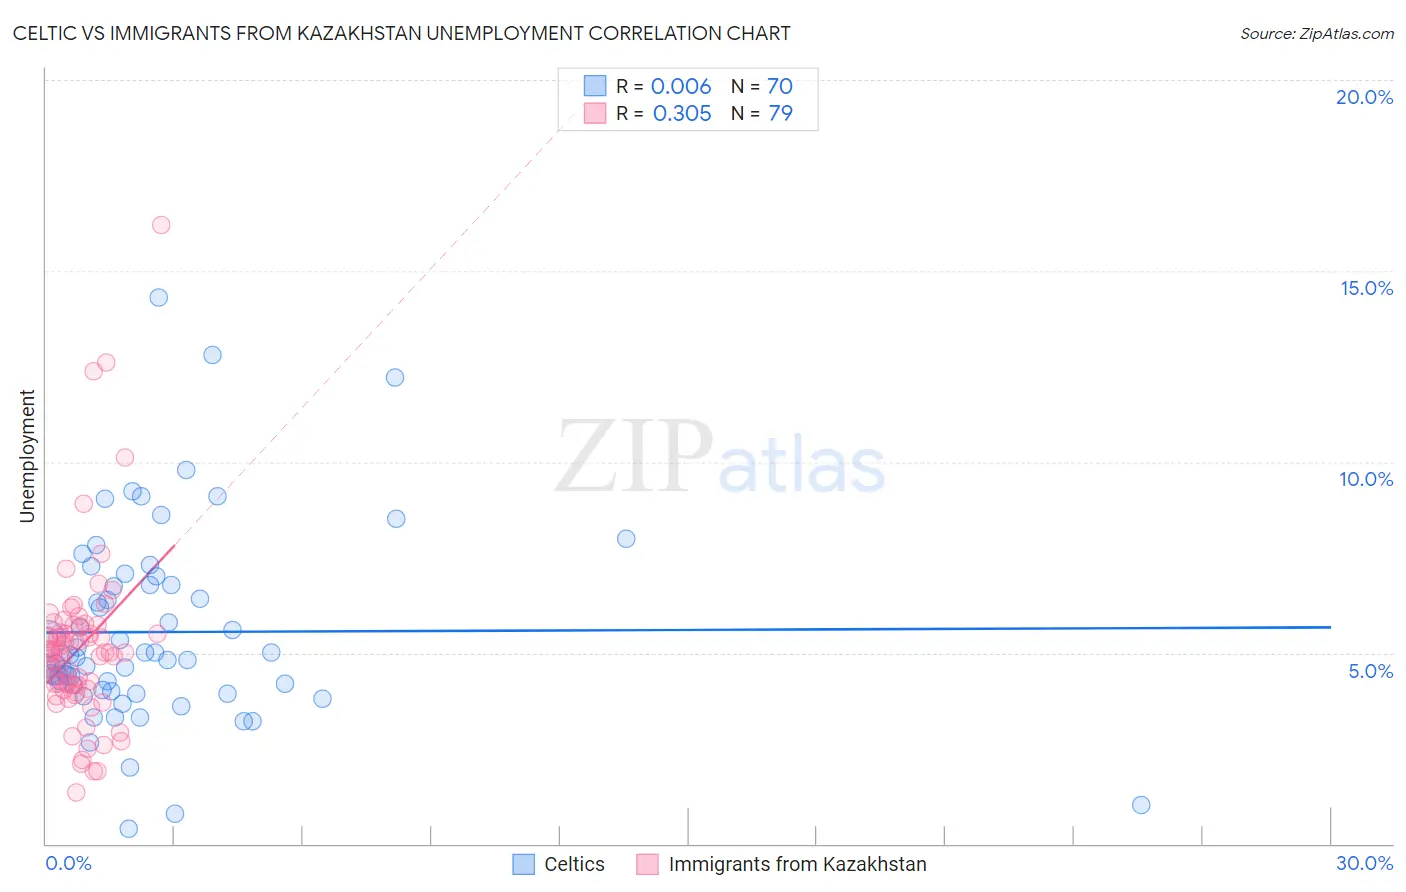
Celtic vs Immigrants from Kazakhstan Unemployment Correlation Chart
The statistical analysis conducted on geographies consisting of 168,747,363 people shows no correlation between the proportion of Celtics and unemployment in the United States with a correlation coefficient (R) of 0.006 and weighted average of 4.9%. Similarly, the statistical analysis conducted on geographies consisting of 124,418,650 people shows a mild positive correlation between the proportion of Immigrants from Kazakhstan and unemployment in the United States with a correlation coefficient (R) of 0.305 and weighted average of 5.2%, a difference of 6.3%.
Unemployment Correlation Summary
| Measurement | Celtic | Immigrants from Kazakhstan |
| Minimum | 0.40% | 1.3% |
| Maximum | 14.3% | 16.2% |
| Range | 13.9% | 14.9% |
| Mean | 5.5% | 5.1% |
| Median | 4.8% | 5.0% |
| Interquartile 25% (IQ1) | 4.0% | 4.0% |
| Interquartile 75% (IQ3) | 6.8% | 5.7% |
| Interquartile Range (IQR) | 2.8% | 1.6% |
| Standard Deviation (Sample) | 2.6% | 2.3% |
| Standard Deviation (Population) | 2.6% | 2.3% |
Similar Demographics by Unemployment
Demographics Similar to Celtics by Unemployment
In terms of unemployment, the demographic groups most similar to Celtics are Immigrants from Singapore (4.9%, a difference of 0.070%), Australian (4.9%, a difference of 0.16%), Greek (4.9%, a difference of 0.17%), Eastern European (4.9%, a difference of 0.19%), and Bhutanese (4.9%, a difference of 0.20%).
| Demographics | Rating | Rank | Unemployment |
| Immigrants | South Central Asia | 99.3 /100 | #49 | Exceptional 4.9% |
| French Canadians | 99.3 /100 | #50 | Exceptional 4.9% |
| Immigrants | Belgium | 99.2 /100 | #51 | Exceptional 4.9% |
| Whites/Caucasians | 99.2 /100 | #52 | Exceptional 4.9% |
| Immigrants | Zimbabwe | 99.2 /100 | #53 | Exceptional 4.9% |
| Eastern Europeans | 99.2 /100 | #54 | Exceptional 4.9% |
| Australians | 99.2 /100 | #55 | Exceptional 4.9% |
| Celtics | 99.1 /100 | #56 | Exceptional 4.9% |
| Immigrants | Singapore | 99.1 /100 | #57 | Exceptional 4.9% |
| Greeks | 99.0 /100 | #58 | Exceptional 4.9% |
| Bhutanese | 99.0 /100 | #59 | Exceptional 4.9% |
| Immigrants | Netherlands | 99.0 /100 | #60 | Exceptional 4.9% |
| Cambodians | 99.0 /100 | #61 | Exceptional 4.9% |
| Icelanders | 98.9 /100 | #62 | Exceptional 4.9% |
| Immigrants | Bulgaria | 98.9 /100 | #63 | Exceptional 4.9% |
Demographics Similar to Immigrants from Kazakhstan by Unemployment
In terms of unemployment, the demographic groups most similar to Immigrants from Kazakhstan are Sri Lankan (5.2%, a difference of 0.060%), Immigrants from Northern Africa (5.2%, a difference of 0.070%), Immigrants from Egypt (5.2%, a difference of 0.27%), Immigrants from Russia (5.2%, a difference of 0.27%), and Laotian (5.2%, a difference of 0.29%).
| Demographics | Rating | Rank | Unemployment |
| Syrians | 77.7 /100 | #149 | Good 5.2% |
| Potawatomi | 76.2 /100 | #150 | Good 5.2% |
| Immigrants | Eastern Europe | 75.3 /100 | #151 | Good 5.2% |
| Immigrants | Hong Kong | 75.2 /100 | #152 | Good 5.2% |
| Egyptians | 75.2 /100 | #153 | Good 5.2% |
| Immigrants | China | 74.7 /100 | #154 | Good 5.2% |
| Immigrants | Northern Africa | 71.3 /100 | #155 | Good 5.2% |
| Immigrants | Kazakhstan | 70.4 /100 | #156 | Good 5.2% |
| Sri Lankans | 69.5 /100 | #157 | Good 5.2% |
| Immigrants | Egypt | 66.7 /100 | #158 | Good 5.2% |
| Immigrants | Russia | 66.6 /100 | #159 | Good 5.2% |
| Laotians | 66.3 /100 | #160 | Good 5.2% |
| Immigrants | Oceania | 65.2 /100 | #161 | Good 5.2% |
| Spanish | 65.1 /100 | #162 | Good 5.2% |
| Immigrants | Zaire | 64.7 /100 | #163 | Good 5.2% |