Celtic vs Immigrants from Grenada Poverty
COMPARE
Celtic
Immigrants from Grenada
Poverty
Poverty Comparison
Celtics
Immigrants from Grenada
12.3%
POVERTY
50.1/ 100
METRIC RATING
173rd/ 347
METRIC RANK
15.8%
POVERTY
0.0/ 100
METRIC RATING
313th/ 347
METRIC RANK
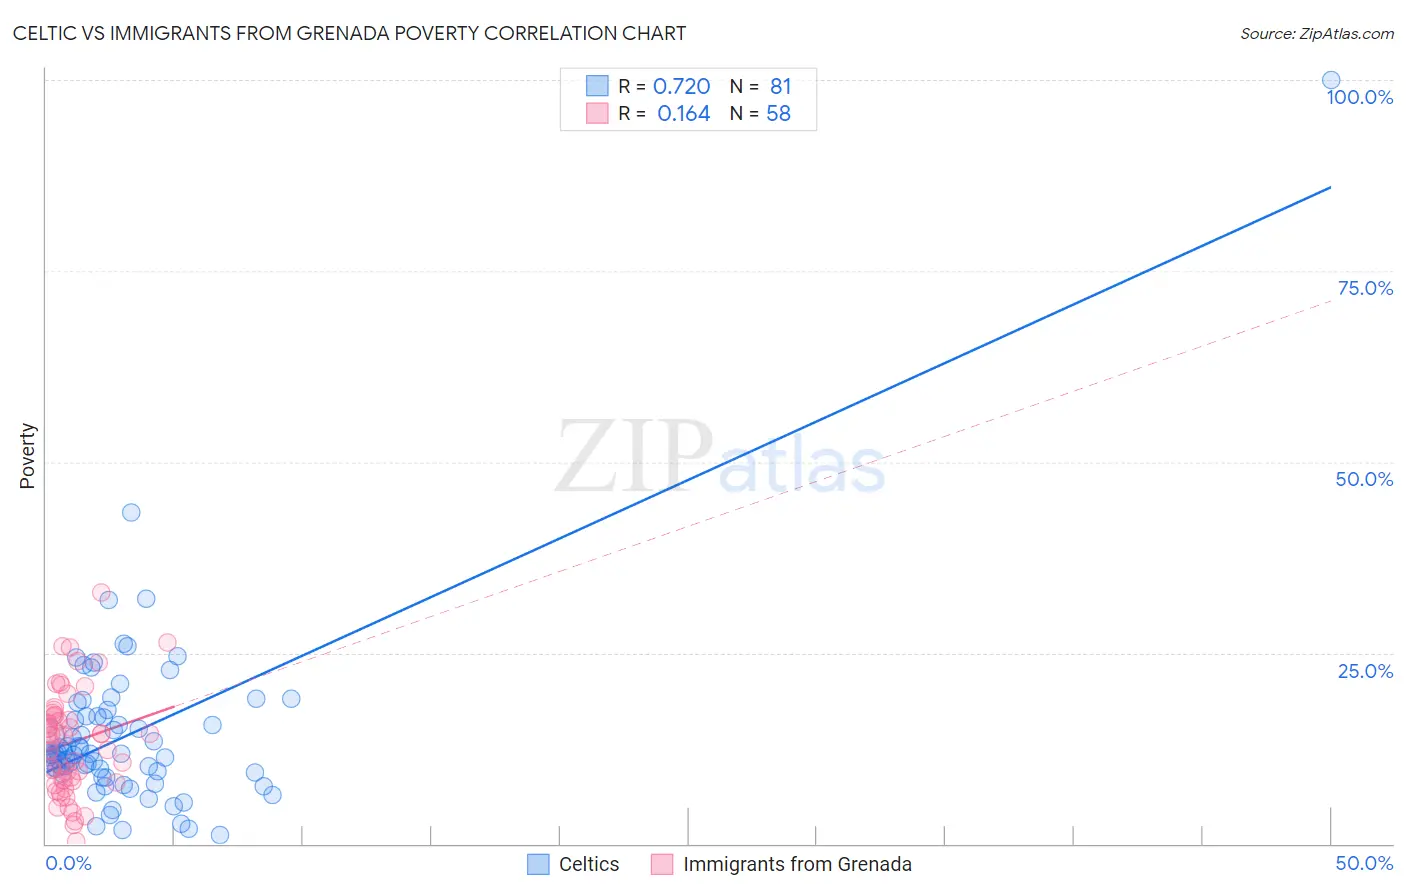
Celtic vs Immigrants from Grenada Poverty Correlation Chart
The statistical analysis conducted on geographies consisting of 168,858,616 people shows a strong positive correlation between the proportion of Celtics and poverty level in the United States with a correlation coefficient (R) of 0.720 and weighted average of 12.3%. Similarly, the statistical analysis conducted on geographies consisting of 67,200,374 people shows a poor positive correlation between the proportion of Immigrants from Grenada and poverty level in the United States with a correlation coefficient (R) of 0.164 and weighted average of 15.8%, a difference of 28.1%.
Poverty Correlation Summary
| Measurement | Celtic | Immigrants from Grenada |
| Minimum | 1.1% | 0.33% |
| Maximum | 100.0% | 32.9% |
| Range | 98.9% | 32.6% |
| Mean | 14.3% | 13.2% |
| Median | 11.7% | 13.8% |
| Interquartile 25% (IQ1) | 9.3% | 8.2% |
| Interquartile 75% (IQ3) | 16.7% | 16.8% |
| Interquartile Range (IQR) | 7.4% | 8.6% |
| Standard Deviation (Sample) | 12.1% | 6.8% |
| Standard Deviation (Population) | 12.1% | 6.8% |
Similar Demographics by Poverty
Demographics Similar to Celtics by Poverty
In terms of poverty, the demographic groups most similar to Celtics are Lebanese (12.3%, a difference of 0.010%), Immigrants from Portugal (12.3%, a difference of 0.040%), Immigrants from Spain (12.3%, a difference of 0.11%), South American (12.3%, a difference of 0.14%), and Immigrants from Colombia (12.3%, a difference of 0.24%).
| Demographics | Rating | Rank | Poverty |
| Venezuelans | 56.9 /100 | #166 | Average 12.2% |
| Immigrants | Chile | 56.7 /100 | #167 | Average 12.2% |
| Immigrants | Venezuela | 56.5 /100 | #168 | Average 12.2% |
| Whites/Caucasians | 55.4 /100 | #169 | Average 12.3% |
| Immigrants | Oceania | 54.6 /100 | #170 | Average 12.3% |
| Immigrants | Spain | 51.3 /100 | #171 | Average 12.3% |
| Immigrants | Portugal | 50.5 /100 | #172 | Average 12.3% |
| Celtics | 50.1 /100 | #173 | Average 12.3% |
| Lebanese | 50.0 /100 | #174 | Average 12.3% |
| South Americans | 48.7 /100 | #175 | Average 12.3% |
| Immigrants | Colombia | 47.7 /100 | #176 | Average 12.3% |
| Immigrants | Syria | 47.5 /100 | #177 | Average 12.3% |
| Uruguayans | 44.7 /100 | #178 | Average 12.4% |
| Immigrants | Morocco | 44.0 /100 | #179 | Average 12.4% |
| Mongolians | 43.6 /100 | #180 | Average 12.4% |
Demographics Similar to Immigrants from Grenada by Poverty
In terms of poverty, the demographic groups most similar to Immigrants from Grenada are Immigrants from Somalia (15.8%, a difference of 0.12%), Cajun (15.7%, a difference of 0.44%), British West Indian (15.9%, a difference of 0.49%), Honduran (15.9%, a difference of 0.49%), and Chippewa (15.7%, a difference of 0.60%).
| Demographics | Rating | Rank | Poverty |
| Creek | 0.0 /100 | #306 | Tragic 15.6% |
| Africans | 0.0 /100 | #307 | Tragic 15.6% |
| Choctaw | 0.0 /100 | #308 | Tragic 15.6% |
| Seminole | 0.0 /100 | #309 | Tragic 15.6% |
| Dutch West Indians | 0.0 /100 | #310 | Tragic 15.6% |
| Chippewa | 0.0 /100 | #311 | Tragic 15.7% |
| Cajuns | 0.0 /100 | #312 | Tragic 15.7% |
| Immigrants | Grenada | 0.0 /100 | #313 | Tragic 15.8% |
| Immigrants | Somalia | 0.0 /100 | #314 | Tragic 15.8% |
| British West Indians | 0.0 /100 | #315 | Tragic 15.9% |
| Hondurans | 0.0 /100 | #316 | Tragic 15.9% |
| U.S. Virgin Islanders | 0.0 /100 | #317 | Tragic 16.1% |
| Immigrants | Dominica | 0.0 /100 | #318 | Tragic 16.1% |
| Immigrants | Congo | 0.0 /100 | #319 | Tragic 16.1% |
| Immigrants | Honduras | 0.0 /100 | #320 | Tragic 16.2% |