Immigrants from Eastern Europe vs Immigrants from Grenada Unemployment
COMPARE
Immigrants from Eastern Europe
Immigrants from Grenada
Unemployment
Unemployment Comparison
Immigrants from Eastern Europe
Immigrants from Grenada
5.2%
UNEMPLOYMENT
75.3/ 100
METRIC RATING
151st/ 347
METRIC RANK
6.9%
UNEMPLOYMENT
0.0/ 100
METRIC RATING
323rd/ 347
METRIC RANK
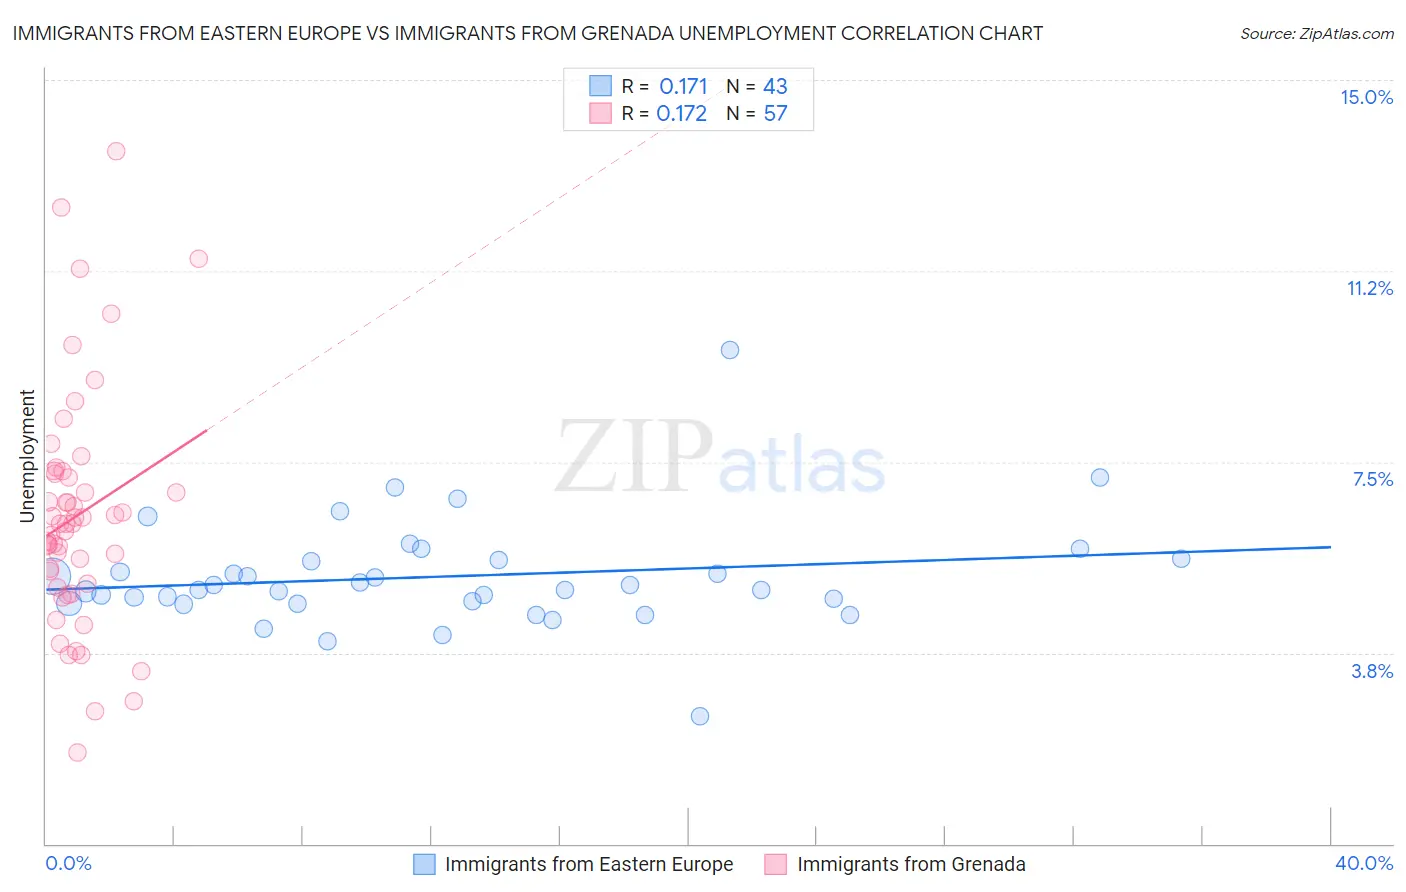
Immigrants from Eastern Europe vs Immigrants from Grenada Unemployment Correlation Chart
The statistical analysis conducted on geographies consisting of 474,836,774 people shows a poor positive correlation between the proportion of Immigrants from Eastern Europe and unemployment in the United States with a correlation coefficient (R) of 0.171 and weighted average of 5.2%. Similarly, the statistical analysis conducted on geographies consisting of 67,187,292 people shows a poor positive correlation between the proportion of Immigrants from Grenada and unemployment in the United States with a correlation coefficient (R) of 0.172 and weighted average of 6.9%, a difference of 33.8%.
Unemployment Correlation Summary
| Measurement | Immigrants from Eastern Europe | Immigrants from Grenada |
| Minimum | 2.5% | 1.8% |
| Maximum | 9.7% | 13.6% |
| Range | 7.2% | 11.8% |
| Mean | 5.2% | 6.4% |
| Median | 5.0% | 6.3% |
| Interquartile 25% (IQ1) | 4.7% | 5.1% |
| Interquartile 75% (IQ3) | 5.6% | 7.3% |
| Interquartile Range (IQR) | 0.84% | 2.2% |
| Standard Deviation (Sample) | 1.1% | 2.3% |
| Standard Deviation (Population) | 1.1% | 2.3% |
Similar Demographics by Unemployment
Demographics Similar to Immigrants from Eastern Europe by Unemployment
In terms of unemployment, the demographic groups most similar to Immigrants from Eastern Europe are Immigrants from Hong Kong (5.2%, a difference of 0.010%), Egyptian (5.2%, a difference of 0.010%), Immigrants from China (5.2%, a difference of 0.050%), Potawatomi (5.2%, a difference of 0.070%), and Syrian (5.2%, a difference of 0.21%).
| Demographics | Rating | Rank | Unemployment |
| Indonesians | 82.3 /100 | #144 | Excellent 5.1% |
| Immigrants | Norway | 81.8 /100 | #145 | Excellent 5.1% |
| Immigrants | Asia | 81.8 /100 | #146 | Excellent 5.1% |
| Indians (Asian) | 81.6 /100 | #147 | Excellent 5.1% |
| Immigrants | Italy | 79.1 /100 | #148 | Good 5.1% |
| Syrians | 77.7 /100 | #149 | Good 5.2% |
| Potawatomi | 76.2 /100 | #150 | Good 5.2% |
| Immigrants | Eastern Europe | 75.3 /100 | #151 | Good 5.2% |
| Immigrants | Hong Kong | 75.2 /100 | #152 | Good 5.2% |
| Egyptians | 75.2 /100 | #153 | Good 5.2% |
| Immigrants | China | 74.7 /100 | #154 | Good 5.2% |
| Immigrants | Northern Africa | 71.3 /100 | #155 | Good 5.2% |
| Immigrants | Kazakhstan | 70.4 /100 | #156 | Good 5.2% |
| Sri Lankans | 69.5 /100 | #157 | Good 5.2% |
| Immigrants | Egypt | 66.7 /100 | #158 | Good 5.2% |
Demographics Similar to Immigrants from Grenada by Unemployment
In terms of unemployment, the demographic groups most similar to Immigrants from Grenada are Guyanese (6.9%, a difference of 0.32%), Immigrants from Guyana (6.9%, a difference of 0.36%), Immigrants from St. Vincent and the Grenadines (6.9%, a difference of 0.37%), Immigrants from Armenia (7.0%, a difference of 1.2%), and British West Indian (6.8%, a difference of 1.2%).
| Demographics | Rating | Rank | Unemployment |
| Immigrants | Dominica | 0.0 /100 | #316 | Tragic 6.7% |
| Shoshone | 0.0 /100 | #317 | Tragic 6.8% |
| Immigrants | Cabo Verde | 0.0 /100 | #318 | Tragic 6.8% |
| British West Indians | 0.0 /100 | #319 | Tragic 6.8% |
| Immigrants | St. Vincent and the Grenadines | 0.0 /100 | #320 | Tragic 6.9% |
| Immigrants | Guyana | 0.0 /100 | #321 | Tragic 6.9% |
| Guyanese | 0.0 /100 | #322 | Tragic 6.9% |
| Immigrants | Grenada | 0.0 /100 | #323 | Tragic 6.9% |
| Immigrants | Armenia | 0.0 /100 | #324 | Tragic 7.0% |
| Natives/Alaskans | 0.0 /100 | #325 | Tragic 7.0% |
| Paiute | 0.0 /100 | #326 | Tragic 7.1% |
| Pueblo | 0.0 /100 | #327 | Tragic 7.2% |
| Tsimshian | 0.0 /100 | #328 | Tragic 7.2% |
| Alaska Natives | 0.0 /100 | #329 | Tragic 7.2% |
| Yakama | 0.0 /100 | #330 | Tragic 7.3% |