Zip Codes with the Highest Percentage of Population Employed in Agriculture, Fishing & Hunting in Pasadena, TX
RELATED REPORTS & OPTIONS
Agriculture, Fishing & Hunting
Pasadena
Compare Zip Codes
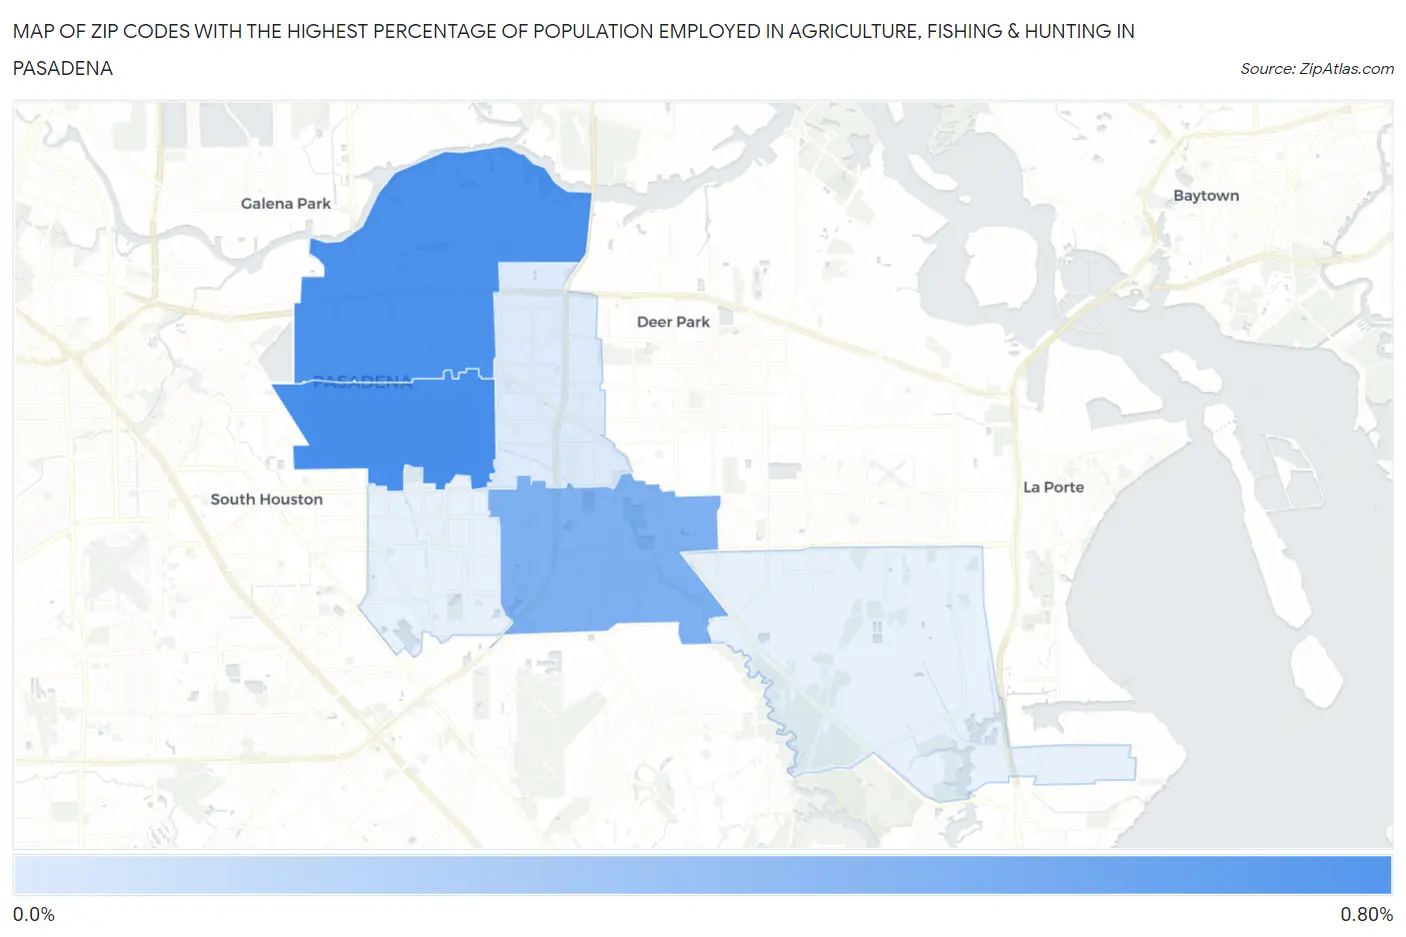
Map of Zip Codes with the Highest Percentage of Population Employed in Agriculture, Fishing & Hunting in Pasadena
0.070%
0.63%
Zip Codes with the Highest Percentage of Population Employed in Agriculture, Fishing & Hunting in Pasadena, TX
| Zip Code | % Employed | vs State | vs National | |
| 1. | 77502 | 0.63% | 0.75%(-0.121)#978 | 1.2%(-0.569)#18,267 |
| 2. | 77506 | 0.61% | 0.75%(-0.139)#985 | 1.2%(-0.587)#18,403 |
| 3. | 77505 | 0.42% | 0.75%(-0.327)#1,076 | 1.2%(-0.775)#19,943 |
| 4. | 77503 | 0.070% | 0.75%(-0.682)#1,402 | 1.2%(-1.13)#24,106 |
1
Common Questions
What are the Top 5 Zip Codes with the Highest Percentage of Population Employed in Agriculture, Fishing & Hunting in Pasadena, TX?
Top 5 Zip Codes with the Highest Percentage of Population Employed in Agriculture, Fishing & Hunting in Pasadena, TX are:
What zip code has the Highest Percentage of Population Employed in Agriculture, Fishing & Hunting in Pasadena, TX?
77502 has the Highest Percentage of Population Employed in Agriculture, Fishing & Hunting in Pasadena, TX with 0.63%.
What is the Percentage of Population Employed in Agriculture, Fishing & Hunting in Pasadena, TX?
Percentage of Population Employed in Agriculture, Fishing & Hunting in Pasadena is 0.37%.
What is the Percentage of Population Employed in Agriculture, Fishing & Hunting in Texas?
Percentage of Population Employed in Agriculture, Fishing & Hunting in Texas is 0.75%.
What is the Percentage of Population Employed in Agriculture, Fishing & Hunting in the United States?
Percentage of Population Employed in Agriculture, Fishing & Hunting in the United States is 1.2%.