Zip Codes with the Highest Percentage of Mexican Population in Pasadena, TX
RELATED REPORTS & OPTIONS
Mexican
Pasadena
Compare Zip Codes
Map of Zip Codes with the Highest Percentage of Mexican Population in Pasadena
15.69%
80.22%
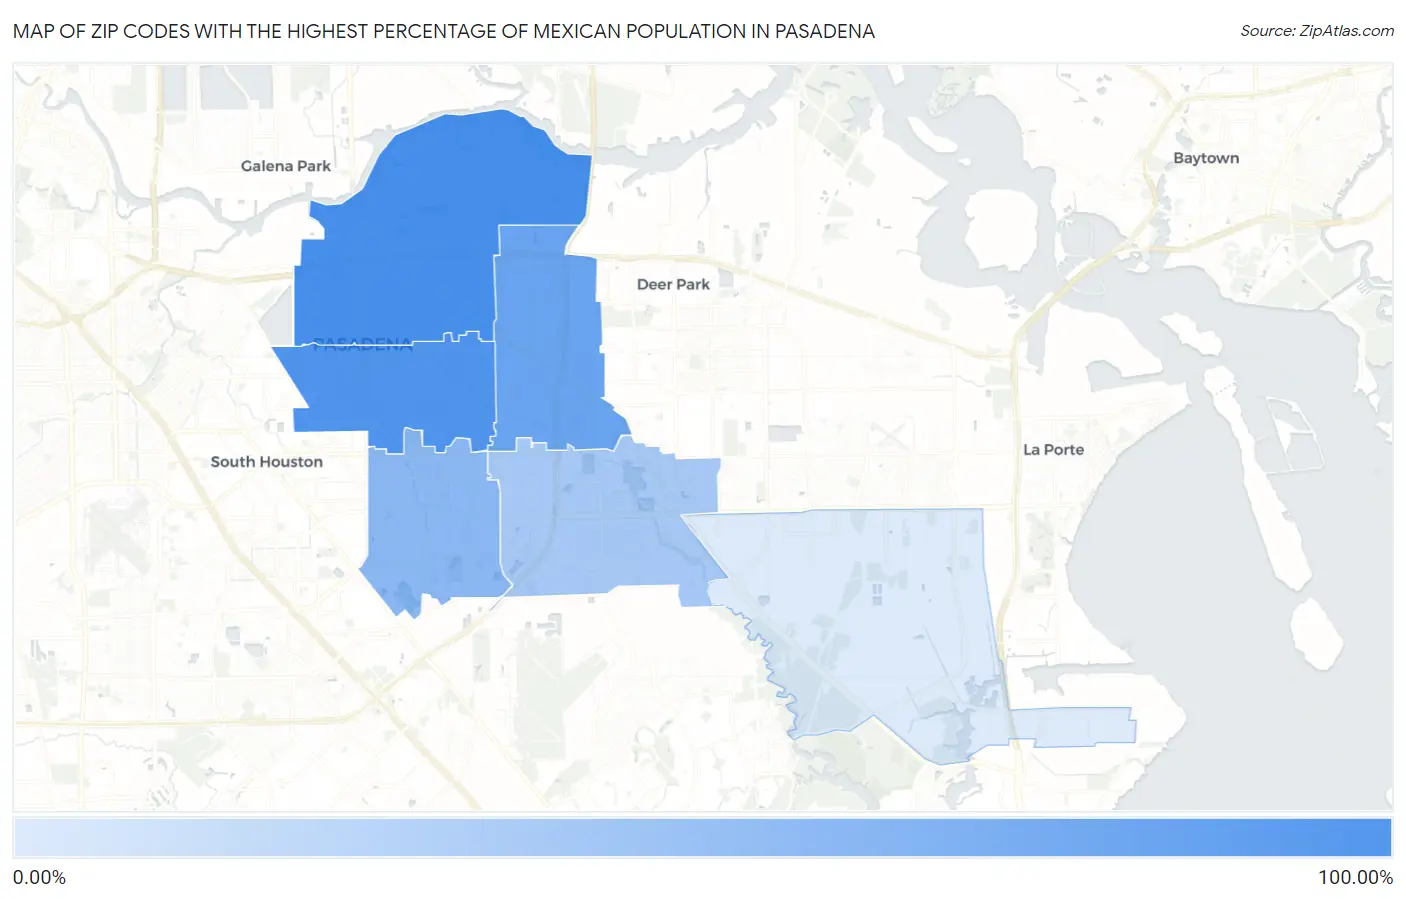
Zip Codes with the Highest Percentage of Mexican Population in Pasadena, TX
| Zip Code | Mexican | vs State | vs National | |
| 1. | 77506 | 80.22% | 32.96% (+47.3)#132 | 11.22% (+69.0)#238 |
| 2. | 77502 | 76.31% | 32.96% (+43.4)#154 | 11.22% (+65.1)#294 |
| 3. | 77503 | 62.26% | 32.96% (+29.3)#252 | 11.22% (+51.0)#541 |
| 4. | 77504 | 47.45% | 32.96% (+14.5)#388 | 11.22% (+36.2)#924 |
| 5. | 77505 | 36.66% | 32.96% (+3.70)#555 | 11.22% (+25.4)#1,409 |
| 6. | 77507 | 15.69% | 32.96% (-17.3)#1,140 | 11.22% (+4.47)#3,597 |
1
Common Questions
What are the Top 5 Zip Codes with the Highest Percentage of Mexican Population in Pasadena, TX?
Top 5 Zip Codes with the Highest Percentage of Mexican Population in Pasadena, TX are:
What zip code has the Highest Percentage of Mexican Population in Pasadena, TX?
77506 has the Highest Percentage of Mexican Population in Pasadena, TX with 80.22%.
What is the Percentage of Mexican Population in Pasadena, TX?
Percentage of Mexican Population in Pasadena is 60.69%.
What is the Percentage of Mexican Population in Texas?
Percentage of Mexican Population in Texas is 32.96%.
What is the Percentage of Mexican Population in the United States?
Percentage of Mexican Population in the United States is 11.22%.