Subsaharan African vs Marshallese Child Poverty Under the Age of 5
COMPARE
Subsaharan African
Marshallese
Child Poverty Under the Age of 5
Child Poverty Under the Age of 5 Comparison
Sub-Saharan Africans
Marshallese
20.8%
CHILD POVERTY UNDER THE AGE OF 5
0.0/ 100
METRIC RATING
279th/ 347
METRIC RANK
19.7%
CHILD POVERTY UNDER THE AGE OF 5
0.4/ 100
METRIC RATING
248th/ 347
METRIC RANK
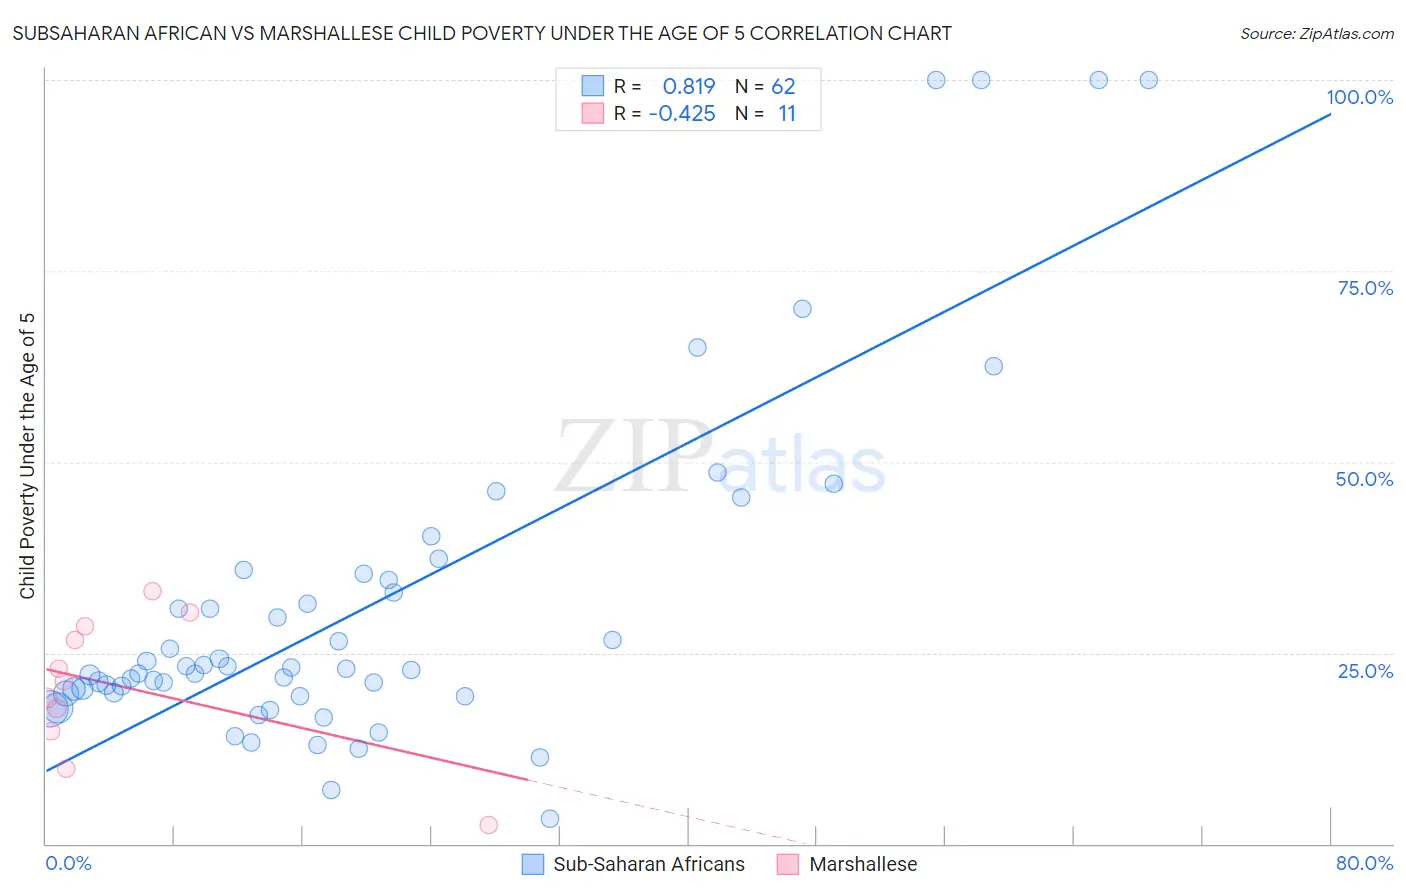
Subsaharan African vs Marshallese Child Poverty Under the Age of 5 Correlation Chart
The statistical analysis conducted on geographies consisting of 484,697,114 people shows a very strong positive correlation between the proportion of Sub-Saharan Africans and poverty level among children under the age of 5 in the United States with a correlation coefficient (R) of 0.819 and weighted average of 20.8%. Similarly, the statistical analysis conducted on geographies consisting of 14,701,855 people shows a moderate negative correlation between the proportion of Marshallese and poverty level among children under the age of 5 in the United States with a correlation coefficient (R) of -0.425 and weighted average of 19.7%, a difference of 5.2%.
Child Poverty Under the Age of 5 Correlation Summary
| Measurement | Subsaharan African | Marshallese |
| Minimum | 3.3% | 2.4% |
| Maximum | 100.0% | 33.0% |
| Range | 96.7% | 30.6% |
| Mean | 30.9% | 20.6% |
| Median | 22.8% | 21.2% |
| Interquartile 25% (IQ1) | 19.6% | 14.8% |
| Interquartile 75% (IQ3) | 34.5% | 28.6% |
| Interquartile Range (IQR) | 14.9% | 13.8% |
| Standard Deviation (Sample) | 22.3% | 9.2% |
| Standard Deviation (Population) | 22.2% | 8.8% |
Similar Demographics by Child Poverty Under the Age of 5
Demographics Similar to Sub-Saharan Africans by Child Poverty Under the Age of 5
In terms of child poverty under the age of 5, the demographic groups most similar to Sub-Saharan Africans are Immigrants from Grenada (20.7%, a difference of 0.37%), Immigrants from West Indies (20.7%, a difference of 0.39%), French American Indian (20.8%, a difference of 0.41%), West Indian (20.6%, a difference of 0.56%), and Senegalese (20.9%, a difference of 0.64%).
| Demographics | Rating | Rank | Child Poverty Under the Age of 5 |
| Immigrants | Jamaica | 0.1 /100 | #272 | Tragic 20.5% |
| Central Americans | 0.1 /100 | #273 | Tragic 20.6% |
| Immigrants | Belize | 0.1 /100 | #274 | Tragic 20.6% |
| Bangladeshis | 0.1 /100 | #275 | Tragic 20.6% |
| West Indians | 0.0 /100 | #276 | Tragic 20.6% |
| Immigrants | West Indies | 0.0 /100 | #277 | Tragic 20.7% |
| Immigrants | Grenada | 0.0 /100 | #278 | Tragic 20.7% |
| Sub-Saharan Africans | 0.0 /100 | #279 | Tragic 20.8% |
| French American Indians | 0.0 /100 | #280 | Tragic 20.8% |
| Senegalese | 0.0 /100 | #281 | Tragic 20.9% |
| Potawatomi | 0.0 /100 | #282 | Tragic 21.0% |
| Comanche | 0.0 /100 | #283 | Tragic 21.0% |
| Somalis | 0.0 /100 | #284 | Tragic 21.1% |
| Haitians | 0.0 /100 | #285 | Tragic 21.2% |
| Immigrants | Latin America | 0.0 /100 | #286 | Tragic 21.2% |
Demographics Similar to Marshallese by Child Poverty Under the Age of 5
In terms of child poverty under the age of 5, the demographic groups most similar to Marshallese are Guyanese (19.7%, a difference of 0.010%), Immigrants from Middle Africa (19.7%, a difference of 0.020%), Nonimmigrants (19.7%, a difference of 0.070%), Cree (19.7%, a difference of 0.17%), and Pennsylvania German (19.8%, a difference of 0.24%).
| Demographics | Rating | Rank | Child Poverty Under the Age of 5 |
| Alaska Natives | 0.5 /100 | #241 | Tragic 19.6% |
| Immigrants | Guyana | 0.5 /100 | #242 | Tragic 19.6% |
| Osage | 0.5 /100 | #243 | Tragic 19.6% |
| Immigrants | Ghana | 0.5 /100 | #244 | Tragic 19.6% |
| Immigrants | Western Africa | 0.4 /100 | #245 | Tragic 19.7% |
| Cree | 0.4 /100 | #246 | Tragic 19.7% |
| Guyanese | 0.4 /100 | #247 | Tragic 19.7% |
| Marshallese | 0.4 /100 | #248 | Tragic 19.7% |
| Immigrants | Middle Africa | 0.4 /100 | #249 | Tragic 19.7% |
| Immigrants | Nonimmigrants | 0.4 /100 | #250 | Tragic 19.7% |
| Pennsylvania Germans | 0.3 /100 | #251 | Tragic 19.8% |
| Immigrants | Nicaragua | 0.3 /100 | #252 | Tragic 19.8% |
| Mexican American Indians | 0.3 /100 | #253 | Tragic 19.9% |
| Fijians | 0.3 /100 | #254 | Tragic 19.9% |
| Immigrants | Cuba | 0.2 /100 | #255 | Tragic 19.9% |