Belgian vs Laotian Single Female Poverty
COMPARE
Belgian
Laotian
Single Female Poverty
Single Female Poverty Comparison
Belgians
Laotians
21.5%
SINGLE FEMALE POVERTY
16.1/ 100
METRIC RATING
206th/ 347
METRIC RANK
19.3%
SINGLE FEMALE POVERTY
99.5/ 100
METRIC RATING
68th/ 347
METRIC RANK
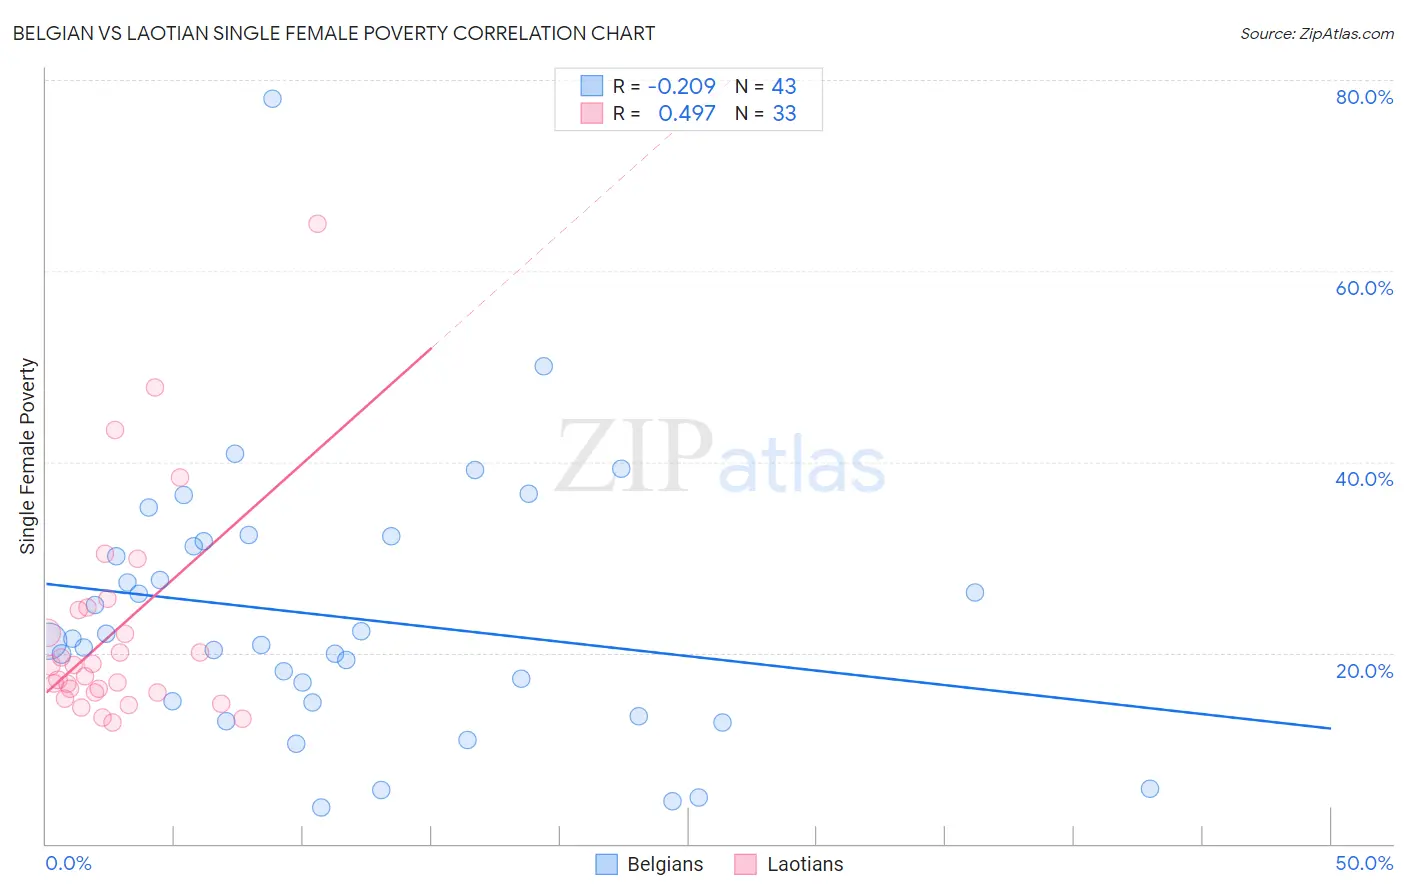
Belgian vs Laotian Single Female Poverty Correlation Chart
The statistical analysis conducted on geographies consisting of 349,903,575 people shows a weak negative correlation between the proportion of Belgians and poverty level among single females in the United States with a correlation coefficient (R) of -0.209 and weighted average of 21.5%. Similarly, the statistical analysis conducted on geographies consisting of 222,876,805 people shows a moderate positive correlation between the proportion of Laotians and poverty level among single females in the United States with a correlation coefficient (R) of 0.497 and weighted average of 19.3%, a difference of 11.9%.
Single Female Poverty Correlation Summary
| Measurement | Belgian | Laotian |
| Minimum | 3.8% | 12.6% |
| Maximum | 78.0% | 64.9% |
| Range | 74.2% | 52.3% |
| Mean | 23.7% | 22.3% |
| Median | 21.2% | 18.7% |
| Interquartile 25% (IQ1) | 14.8% | 15.9% |
| Interquartile 75% (IQ3) | 31.6% | 24.6% |
| Interquartile Range (IQR) | 16.8% | 8.7% |
| Standard Deviation (Sample) | 13.9% | 11.4% |
| Standard Deviation (Population) | 13.7% | 11.2% |
Similar Demographics by Single Female Poverty
Demographics Similar to Belgians by Single Female Poverty
In terms of single female poverty, the demographic groups most similar to Belgians are Finnish (21.5%, a difference of 0.020%), Ghanaian (21.6%, a difference of 0.040%), Immigrants from Africa (21.5%, a difference of 0.070%), Haitian (21.6%, a difference of 0.070%), and Immigrants from Eastern Africa (21.6%, a difference of 0.11%).
| Demographics | Rating | Rank | Single Female Poverty |
| Immigrants | Immigrants | 22.0 /100 | #199 | Fair 21.4% |
| Irish | 21.4 /100 | #200 | Fair 21.4% |
| Nigerians | 20.9 /100 | #201 | Fair 21.4% |
| Immigrants | Kenya | 20.7 /100 | #202 | Fair 21.4% |
| Immigrants | Haiti | 18.8 /100 | #203 | Poor 21.5% |
| Immigrants | Africa | 16.7 /100 | #204 | Poor 21.5% |
| Finns | 16.2 /100 | #205 | Poor 21.5% |
| Belgians | 16.1 /100 | #206 | Poor 21.5% |
| Ghanaians | 15.7 /100 | #207 | Poor 21.6% |
| Haitians | 15.4 /100 | #208 | Poor 21.6% |
| Immigrants | Eastern Africa | 15.1 /100 | #209 | Poor 21.6% |
| Immigrants | Panama | 14.4 /100 | #210 | Poor 21.6% |
| Icelanders | 14.0 /100 | #211 | Poor 21.6% |
| Jamaicans | 14.0 /100 | #212 | Poor 21.6% |
| Guamanians/Chamorros | 13.7 /100 | #213 | Poor 21.6% |
Demographics Similar to Laotians by Single Female Poverty
In terms of single female poverty, the demographic groups most similar to Laotians are Immigrants from Egypt (19.2%, a difference of 0.040%), Palestinian (19.2%, a difference of 0.080%), Cypriot (19.2%, a difference of 0.10%), Immigrants from Europe (19.2%, a difference of 0.12%), and Immigrants from Northern Europe (19.2%, a difference of 0.13%).
| Demographics | Rating | Rank | Single Female Poverty |
| Cambodians | 99.6 /100 | #61 | Exceptional 19.2% |
| Lithuanians | 99.6 /100 | #62 | Exceptional 19.2% |
| Immigrants | Northern Europe | 99.6 /100 | #63 | Exceptional 19.2% |
| Immigrants | Europe | 99.6 /100 | #64 | Exceptional 19.2% |
| Cypriots | 99.6 /100 | #65 | Exceptional 19.2% |
| Palestinians | 99.6 /100 | #66 | Exceptional 19.2% |
| Immigrants | Egypt | 99.6 /100 | #67 | Exceptional 19.2% |
| Laotians | 99.5 /100 | #68 | Exceptional 19.3% |
| Paraguayans | 99.5 /100 | #69 | Exceptional 19.3% |
| Immigrants | Jordan | 99.4 /100 | #70 | Exceptional 19.3% |
| Immigrants | South Eastern Asia | 99.4 /100 | #71 | Exceptional 19.3% |
| Immigrants | Latvia | 99.4 /100 | #72 | Exceptional 19.3% |
| Immigrants | Peru | 99.4 /100 | #73 | Exceptional 19.3% |
| Immigrants | Belarus | 99.4 /100 | #74 | Exceptional 19.3% |
| Immigrants | Turkey | 99.4 /100 | #75 | Exceptional 19.4% |